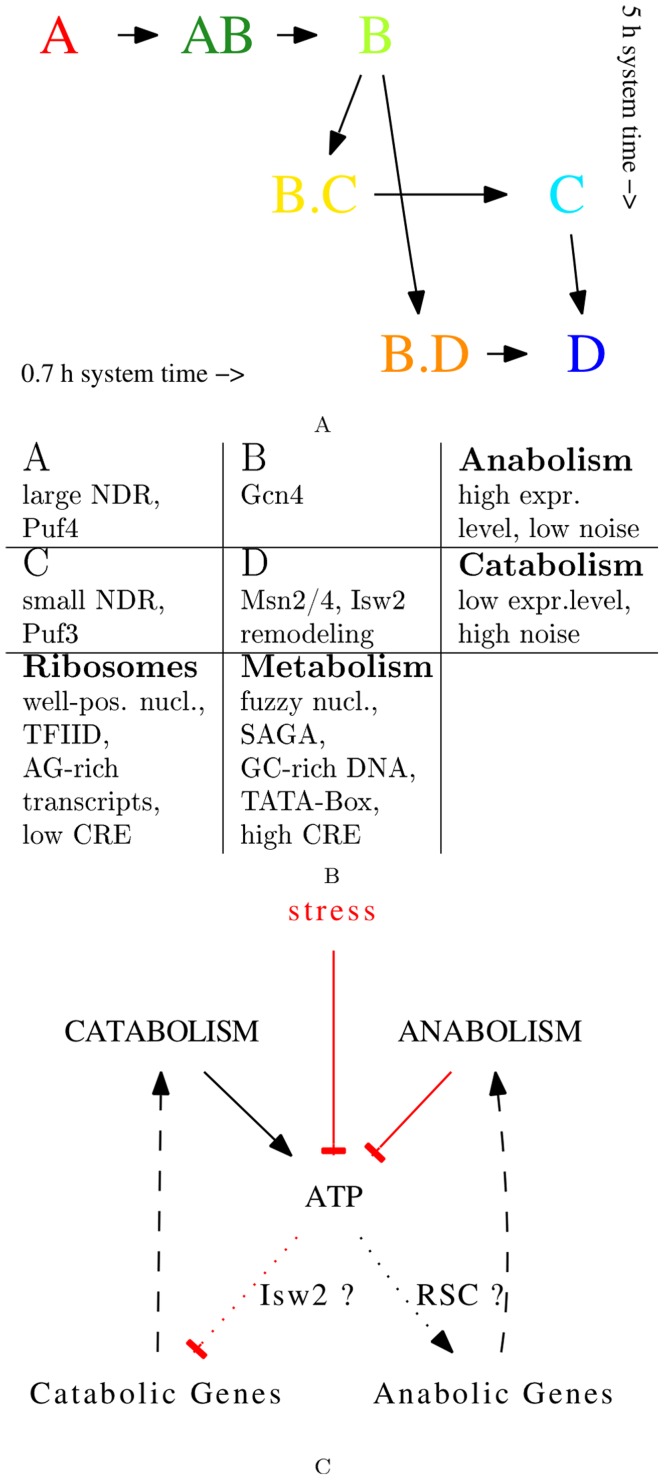
Figure 8. Nucleotide content & in vitro nucleosome occupancy.
Figure 1C provides a color legend. 8A & 8B: local GC- and purine frequencies were first calculated for each gene and each position in sliding windows (size: 71 nt.), and then SDP were constructed using t-tests for statistics visualization. Tests were performed without prior binning of values, and instead values are shown only for each 10th nucleotide position for visual clarity. 8C: in vitro nucleosome reconstitution at low histone levels [37], 1 bp resolution, SDP with bin size 10 bp and Mann-Whitney-Wilcoxon tests. Background clusters are shown in Figure S20.

