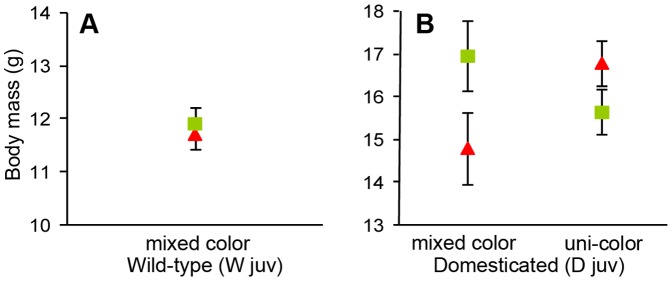
Figure 2. Mean ± SE of body mass measured after manipulating males during the juvenile period.
All males were housed in groups of four males with four females during this period, and within each experimental group the four males were either all wearing the same color bands (uni-color; i.e. all green or all red) or there were two males of each color (mixed color). Symbol colors represent the color assigned during the experiment. (A) shows the data for the wild-type and (B) for the domesticated population.

