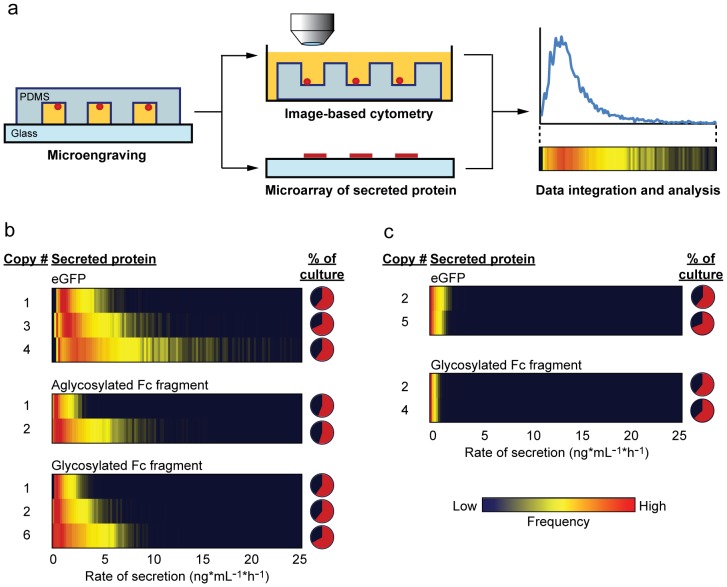
Figure 1. Single-cell analysis of P. pastoris secreting heterologous proteins.
(A) Schematic illustration of process for measuring the distributions in rates of secretion of heterologous proteins by single cells. Yeast cells cultivated by shake-flask fermentation for ∼12–24 h at 25°C were deposited onto an array of microwells at a density of ∼1 cell per well. Microengraving was performed to create a protein microarray comprising the secreted proteins captured from occupants of each individual well. Imaging cytometry was performed to determine number of cells per well. Integration of the data yielded distributions in rates of secretion for single cells; the distributions are represented as heatmaps where the gradient in color (blue to yellow to red) indicates the relative percentage of cells producing at a specific rate. (B) and (C) Heatmap representations of the distributions of single-cell rates of secretion as a function of gene copy number obtained by microengraving for proteins produced using either (B) pGAPDH or (C) pAOX1 promoter. Data shown are representative of at least three independent measurements. The threshold for secretion was determined by the background median fluorescence intensity of each individual protein microarray+2σ. Pie charts indicate average percentages of secreting cells for each strain (red).

