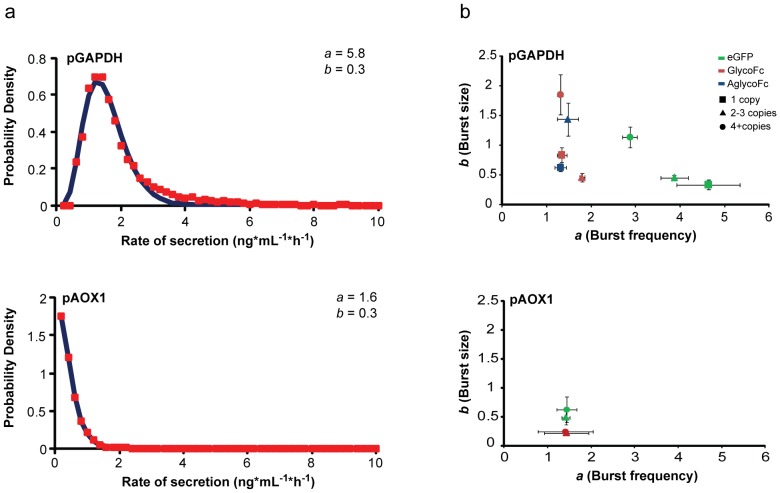
Figure 2. Analysis of steady-state distributions of rates of secretion.
(A) Distributions of rates of secretion of eGFP for (Top) a clone with a single copy of eGFP under transcriptional control of pGAPDH, and (Bottom) a clone with two copies of eGFP under transcriptional control of pAOX1. Red squares indicate binned single-cell secretion events following microengraving with each clone. Blue lines show the best fits using Eq. (1). Values for a and b are shown. (B) Relationship between a (burst frequency) and b (burst size) for proteins expressed using either pGAPDH (top) or pAOX1 (bottom) as a function of gene copy number and complexity. Clones secreting eGFP (green), clones secreting aglycosylated Fc fragment (blue) and clones secreting glycosylated Fc fragment (red) are shown for a single gene copy (squares), 2–3 gene copies (triangles) and 4 or more gene copies (circles). Error bars represent S.E.M. for each clone from at least three separate measurements.

