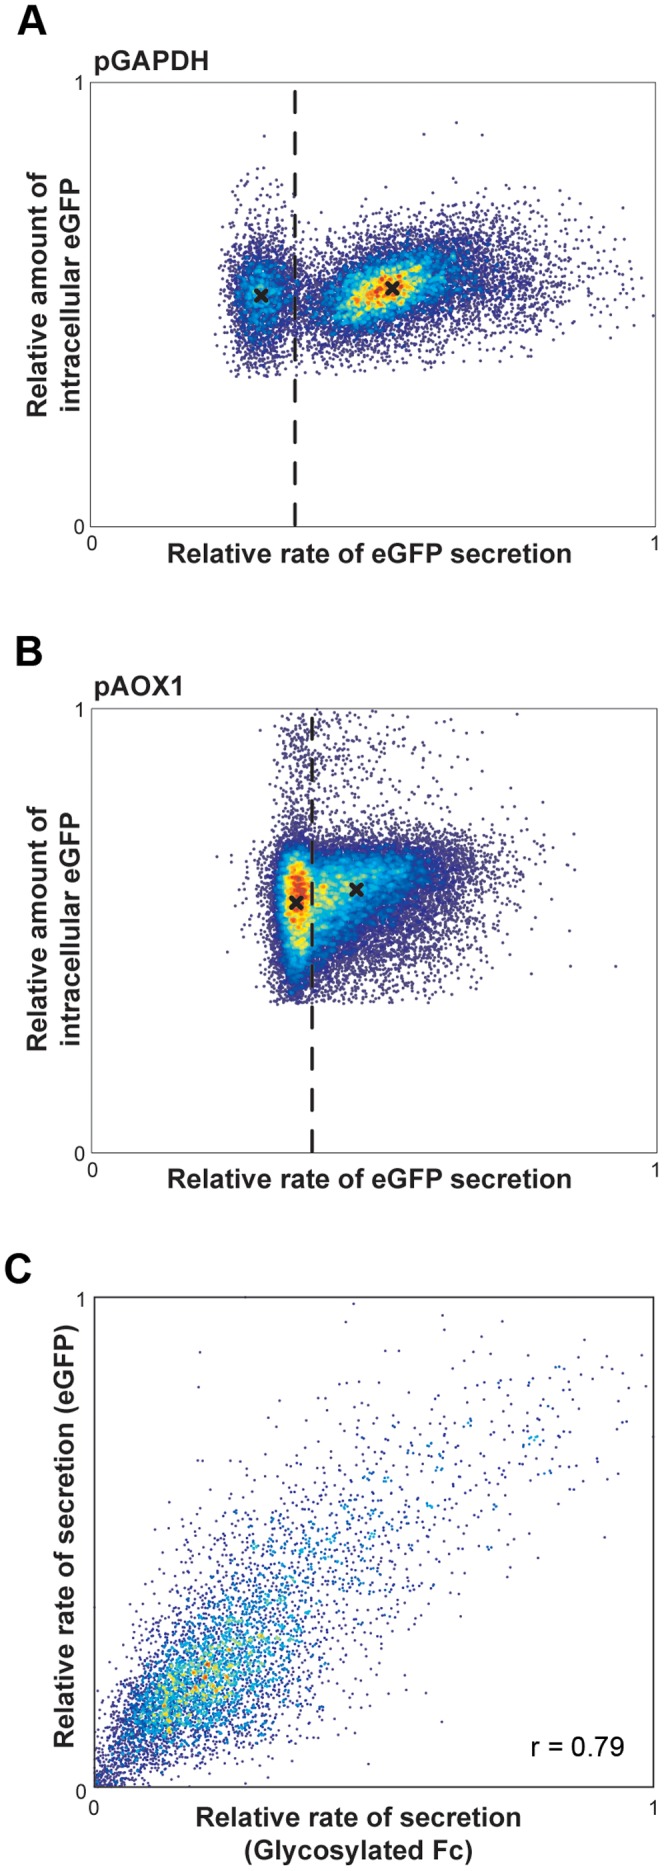
Figure 3. Characterization of relationships between intracellular and secreted proteins for single cells of P. pastoris.

Density plots of the relative rates of eGFP secretion by single cells analyzed by microengraving with respect to the relative amount of intracellular eGFP determined by fluorescence microscopy for clones containing (A) one eGFP gene copy under pGAPDH or (B) two eGFP gene copies under pAOX1. Dashed line indicates the limit of detection for secreted eGFP in microengraving (background+2σ). The median amounts of internal eGFP for cells above and below this limit of detection are marked (X) and are significantly different (Mann-Whitney test, p≪0.001 for both pGAPDH and pAOX strains). (C) Density plot of the relative rates of secretion analyzed by microengraving for the glycosylated Fc fragment and eGFP produced simultaneously in single cells at two different loci using pGAPDH. Pearson's correlation coefficient for secretion of these two proteins as shown is 0.79.
