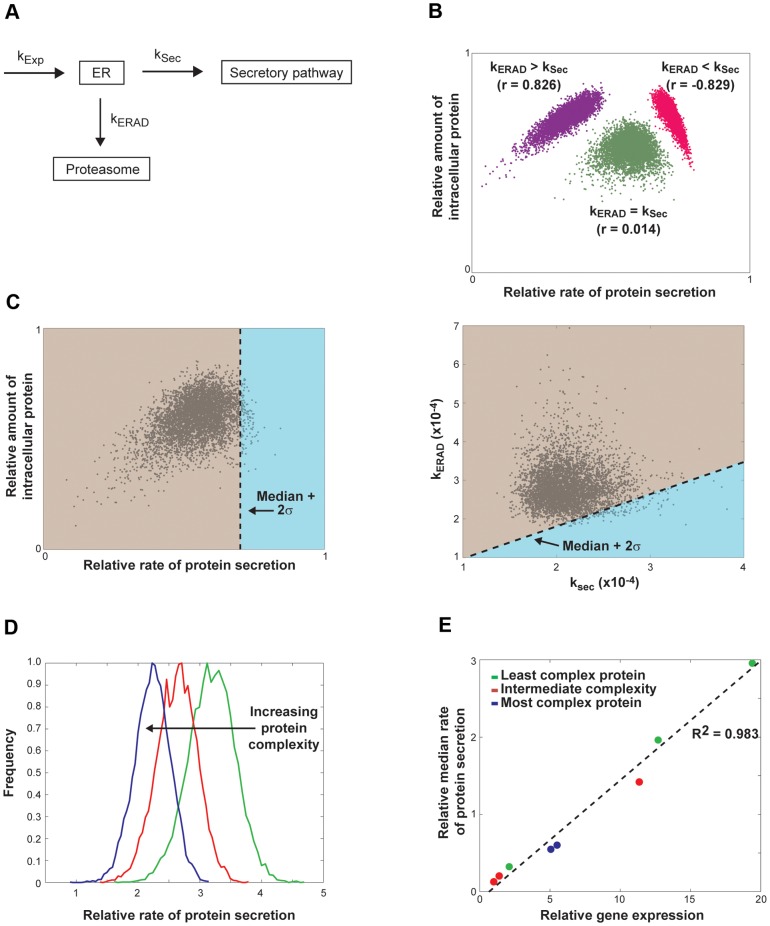
Figure 4. Model for steady-state distribution of protein trafficking through the ER in P. pastoris.
(A) Schematic model for protein secretion that includes flux from the ER via both protein export and degradation. (B) Density plot of the relative rates of protein secretion by single cells compared to the relative amount of intracellular protein calculated with the kinetic model described in equations 2–4 under different relative median rates: kERAD>ksec (purple, r = 0.826); kERAD = ksec (green, r = 0.014); and kERAD<ksec (pink, r = −0.829) (n = 5,000 for each group; Pearson's correlation coefficient for protein production and secretion). (C) Density plot of the relative rates of protein secretion by single cells against the relative amount of intracellular protein for a representative model data set where median kERAD>ksec (left panel). Pearson's correlation coefficient for protein production and secretion in this population is 0.391. Blue shading indicates cells with rates of protein secretion greater than the median rate+2σ (high secretors). These data were replotted as a function of their rate parameters for secretion and degradation; units shown are s−1 (right panel). The median tsec was 80 min and median tERAD was 60 min, with a standard deviation of 10 min for each. (D) Distributions of the relative rates of protein secretion for model populations of cells producing proteins of low (green), intermediate (red), and high complexity (blue). The median tsec value was scaled by a multiplicative constant between 1 and 2 in order to reflect the additional time required to process proteins of higher complexity. (E) Plot of relative gene expression against the median rates of secretion for populations of cells generated using the kinetic model with varying levels of gene expression and protein complexity. Data were fit by linear regression (R2 = 0.983). kexp was multiplied by the relative mRNA expression level in each strain (Table 1), and tsec was scaled as noted in (D) for glycosylated Fc (medium complexity) and aglycosylated Fc (high complexity).

