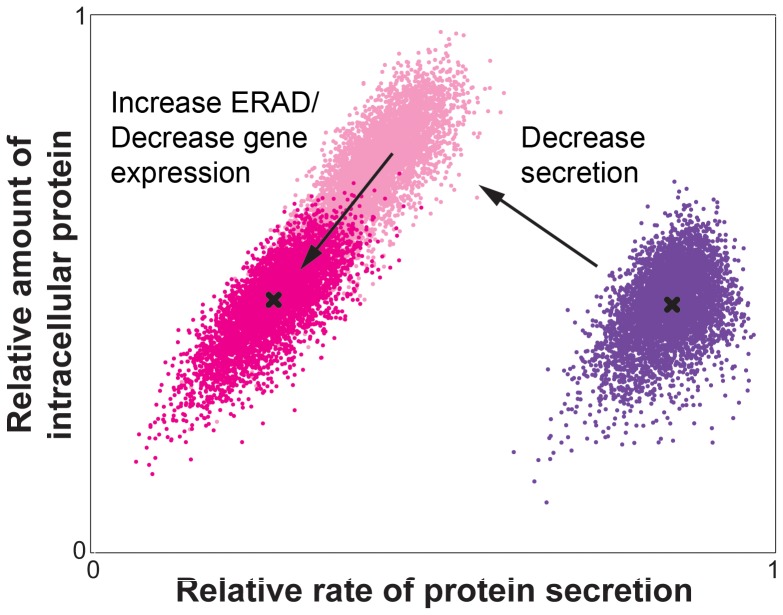
Figure 5. Effects of altering relative rates of secretion and degradation on modeled distribution of intracellular and secreted protein.
Density plot of the relative rates of protein secretion by single cells against the relative amount of intracellular protein for model data sets under three conditions: 1) where median kERAD≥ksec (purple), 2) where median ksec≪ksec in Condition 1 (light pink), and 3) where median ksec≪ksec in Condition 1 and median kERAD>kERAD and/or kexp<kexp in Condition 1 (dark pink). The median amount of intracellular protein for populations in Conditions 1 and 3 are marked (X). The secretion-inhibited population (light pink) was generated by increasing tsec to 400 min (standard deviation 40 min) while keeping all other parameters the same as the initial population (purple) derived from Figure 4C. The stress-induced population (dark pink) was generated by reducing kexp or decreasing tERAD to obtain a similar median level of protein in the ER as the original population.

