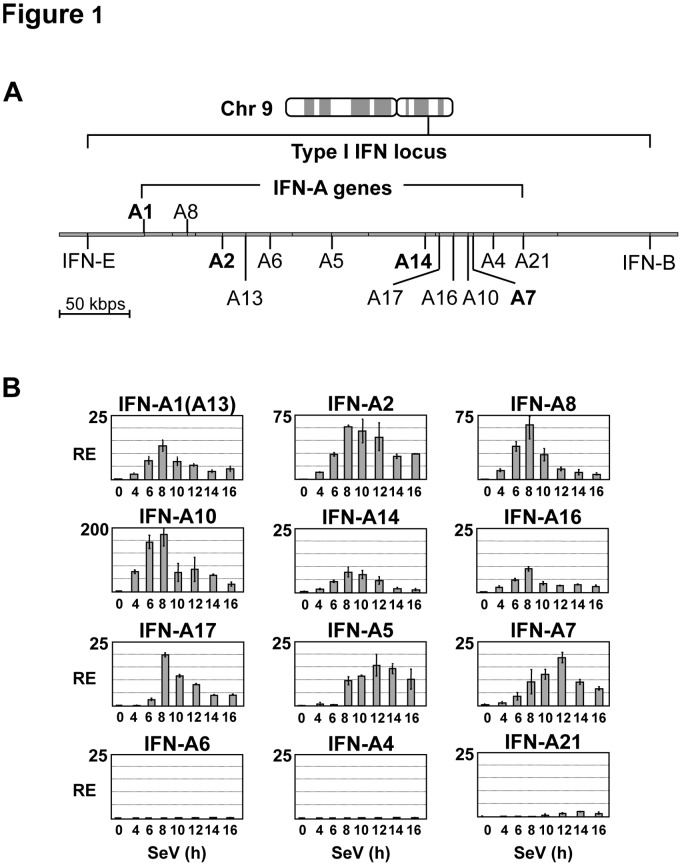
Figure 1. Expression pattern of IFN-A genes in Namalwa B cells infected by Sendai virus.
(A) Type I IFN locus, delimited to 400 kbps on human chromosome 9, consists of thirteen intronless IFN-A genes located in cluster with the IFN-B and IFN-E genes (data retrieved from NCBI library, version 37.1). IFN-A genes analyzed in this study are indicated in bold in the diagram. IFN-A1 and IFN-A8 are in reverse orientation compared to other IFN-A genes. (B) IFN-A gene expression was determined by quantitative RT-QPCR analysis in Namalwa B cells mock-infected (0 h) or infected by Sendai virus for 4–16 h. IFN-A1 expression levels presented in this study represent the total amounts of both IFN-A1 and IFN-A13 mRNAs; the high percentage of sequence homology of IFN-A1 and IFN-A13 genes (99.7% in the coding region) did not allow distinction between these genes. Relative expression (RE) normalized to GAPDH mRNA levels is indicated with standard deviation values calculated in two independent experiments performed in duplicate.

