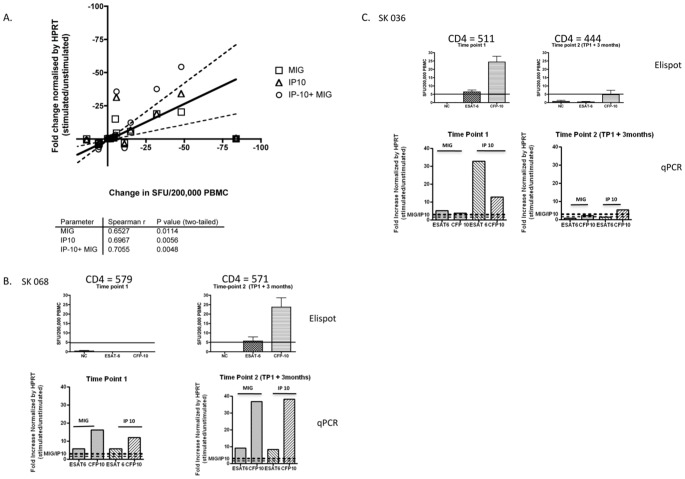
Figure 3. Longitudinal comparison of the ex vivo RD1- Elispot and the RD1-qPCR assay.
A highly sensitive assay of RD1-specific IFN-γ production using real time quantitative PCR (qPCR) for two reporters - monokine-induced by IFN-γ (MIG) and the IFN-γ inducible protein-10 (IP10) was compared longitudinally with the ex vivo RD1-Elispot. Figure 3A: A head-to–head comparison was performed on 14 individuals on samples from 2 time-points 3 months apart. A significant correlation was observed between fold change on the RD1 qPCR and change in SFC using the RD1-Elispot. Figure 3B: Data from SK068. Figure 3C: Data from SK036. Top panel displays RD1-Elispot data and bottom-panel displays RD1-qPCR data.

