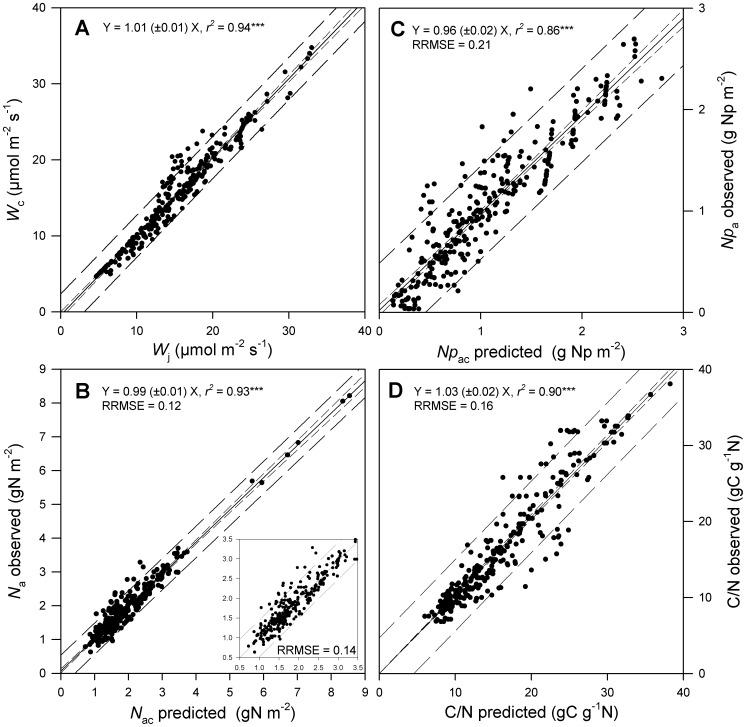
Figure 1. Tests of the coordination hypothesis using experimental values of leaf photosynthetic traits (Vc max, J max, J fac, k 3 and SLA).
A) Relationship between the predicted rates of RuBP carboxylation/oxygenation (W c) and RuBP regeneration (W j) under plant growth conditions. B) Relationship between predicted (N ac) and observed (N a) leaf N content. N a was calculated as the sum of the leaf photosynthetic and structural N contents. Leaf photosynthetic N content was predicted using Eqn 2 with the species-specific parameters k 3 and J fac. C) Relationship between predicted (Np ac) and observed (Np a) photosynthetic leaf N content. D) Relationship between predicted and observed leaf C/N ratio. A common leaf structural N content was used (fns = 0.012 gN g− 1 DM). Solid lines are the regressions. Short-dashed and long-dashed lines indicate the confidence (at 95%) and prediction intervals, respectively. The insert in Fig. 1B shows the same relationship without the very high observed N a values for the PFT1. ***, P<0.001.

