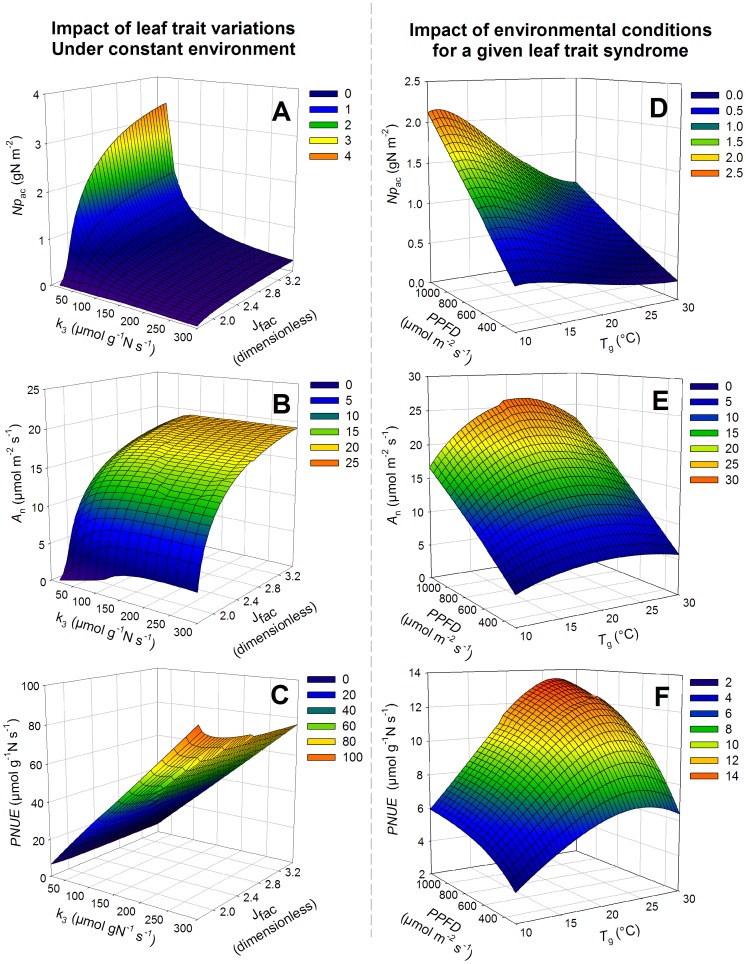
Figure 3. Relationships between simulated photosynthetic leaf N content (Np ac) (A), net photosynthesis (A n) (B) and photosynthetic N use efficiency (PNUE) (C) and the photosynthetic traits k 3 and J fac under standard mean environmental conditions (PPFD = 666 µmol m−2 s−1, T g = 16.9°C, h s = 0.74).
k
3 is the ratio between  and Np
a. J
fac is the ratio between J
max and
  . A mesh of k
3 values varying between 10 and 300 µmol g−1 N s−1 with 20 steps and of J
fac values varying between 1.75 and 3.5 with 0.05 steps was used. Figures D–E–F, relationships between (Np
ac) (D), net photosynthesis (A
n) (E) and photosynthetic N use efficiency (PNUE) (F) and the radiation (PPFD) and temperature (T
g) conditions during growth. Averages over the dataset of leaf photosynthetic parameters (k
3, J
fac and SLA) are used (k
3 = 59.1 µmol g−1
N
pa s−1, J
fac = 2.45, SLA = 17.7 m2 kg−1 DM). The mesh for temperature is 0.5°C between 10 and 30°C and the mesh for radiation is 50 µmol m−2 s−1 between 300 and 1200 µmol m−2 s−1. The values of h
s and T
g were fixed at 0.8 and 20°C, respectively. A
n was calculated with the coordinated leaf protein content and PNUE was calculated as the ratio between A
n and Np
ac.

