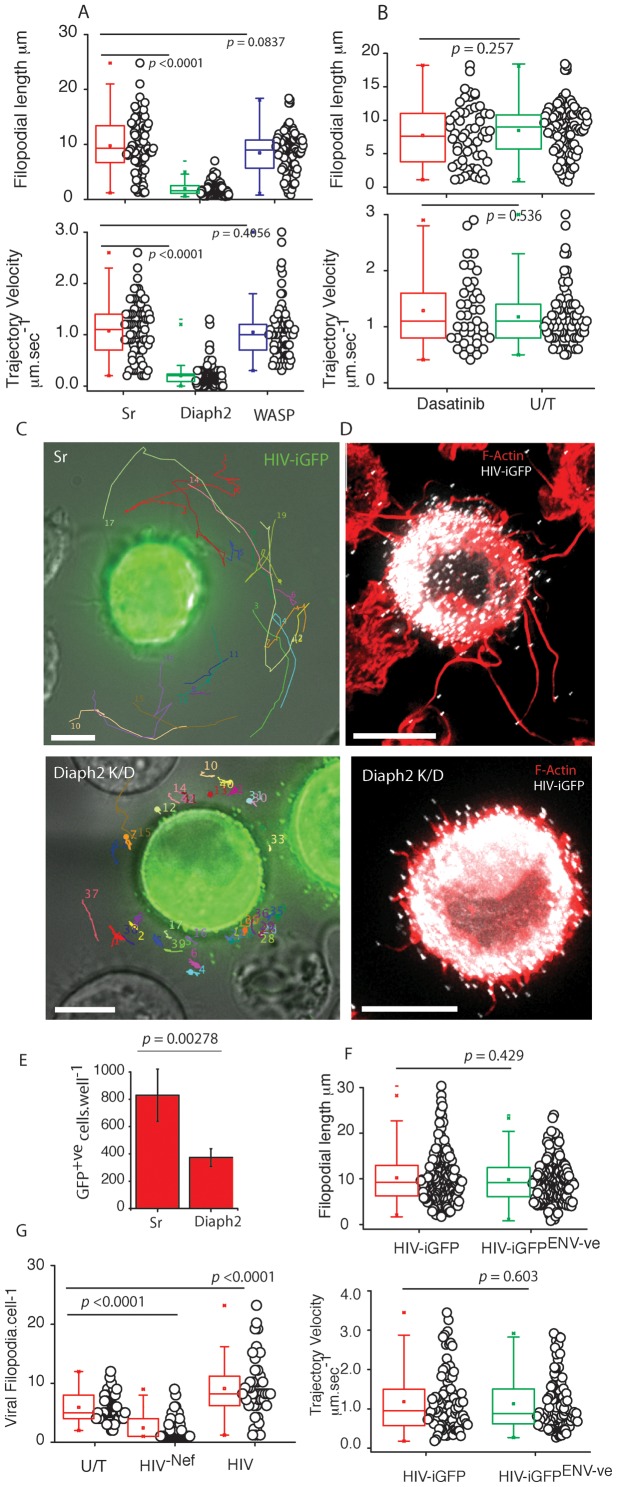
Figure 5. VF form by a Diaph2 dependent pathway with frequency regulated by HIV Nef and not HIV Env.
(A) To further delineate how VF pathway are formed, Wasp and Diaph2 was knockdown in the U937 cell line using shRNA. After 2 weeks of puromycin selection, resistant U937 cell lines were infected with HIV iGFP and VF lengths and trajectory velocities enumerated as in Fig. 4. P values are included to highlight significant differences in each variable. Protein knock-down for Wasp and Diaph2 are presented in Fig. S2E. The house-keeping protein Gapdh is present below to normalize lysate loading. Data is representative of 4 independent infections using HIV iGFP. (B) To rule out manipulation of the Arp2/3 filopodial pathway, the U937 cell line was infected with HIV iGFP and two days post infection, infected cells were treated with the Abl/Src kinase inhibitor Dasatinib at 10 µM for 4 hours. Note, under these conditions Vaccinia actin tails do not form (data not shown). VF were then enumerated for lengths and trajectory velocities as outlined Fig. 3. (C) Accumulative single particle tracking for 1 minute of VF trajectories in scrambled controls (upper panel) versus Diaph2 knockdowns (lower panel). Note the confined trajectories in the absence of Diaph2. Diaph2 knockdown particle tracking is derived from Video S12. Scale bars are 5 µm. Data from knockdown experiments is representative of 4 independent HIV iGFP infections. (D) Fixed cell images of control shRNA (upper panel) and Diaph2 (lower panel) transduced cells infected with HIV iGFP. Note the significantly shorter VF lengths in Diaph2 knockdown U937 cells. Scale bars are 5 µm. Images are representative of 4 independent infections with HIV iGFP. (E) Attenuation of cell-cell transfer in Diaph2 knockdown U937. U937 were infected with HIV and 2 days post infection were stained for HIV p24 and enumerated by flow cytometry. After infections were verified to be equivalent, infected U937 cells were co-cultured at a ratio of 1∶5 with the T cell HIV indicator cell line JLTR-R5. Four days post infection, fluorescent images were acquired for the entire well and enumerated using Image J. Standard deviations represent co-cultures in triplicate. Data is representative of 3 independent infections. (F) VF form in the absence of HIV envelope. DCs were infected with either VSVg pseudotyped HIV iGFP or HIV iGFP-ENV-ve as outlined in Fig. 1. VF were then enumerated for lengths and trajectory velocities as outlined B. Data is representative of four independent infections. P values are presented for significant differences. (G) Deletion of HIV Nef leads to significantly lower VF frequency on DC. Enumeration of VF numbers over time in uninfected DCs (U/T), or HIV infected DCS with HIV−iGFP or HIV-NEF-iGFP. Each point represents live imaging of a VF bearing DC over a period of 2 minutes under imaging conditions outlined in materials and methods. Accumulative data presented is equally drawn from 5 independent donors. Statistical significance is indicated by p values.

