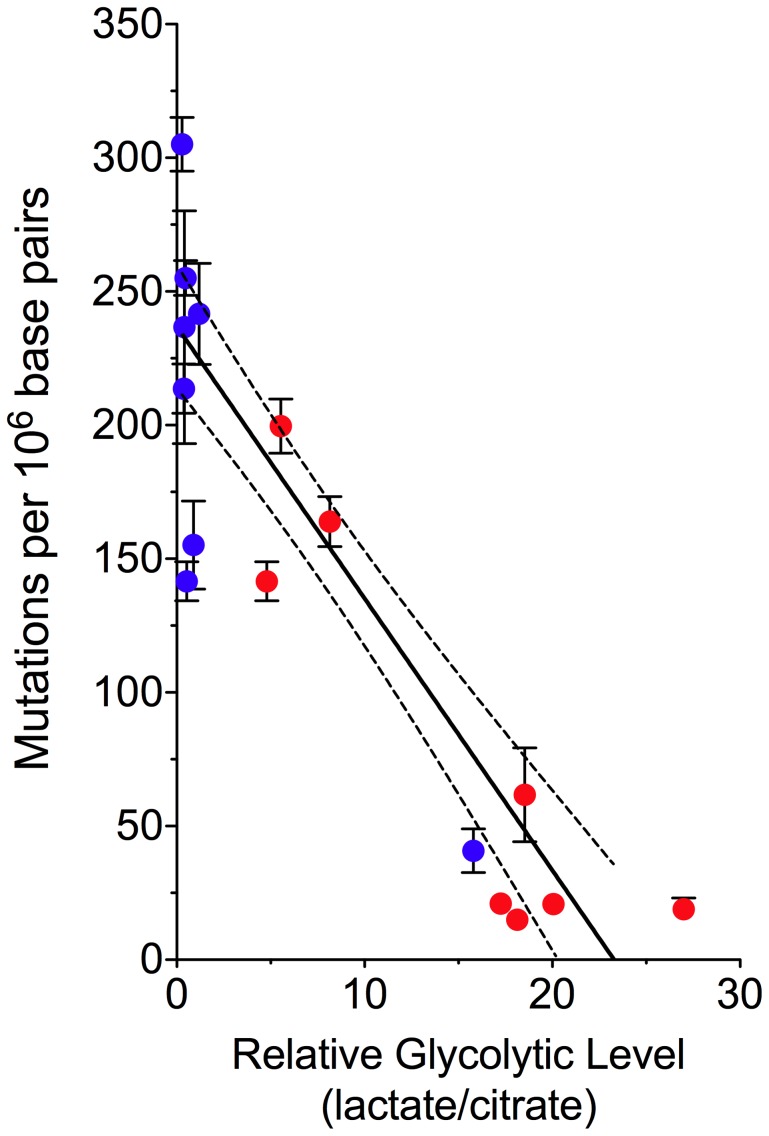
Figure 5. Decreased mtDNA Mutagenesis Is Coupled to a Shift in Glucose Metabolism.
Normal (blue) and tumor (red) patient-matched colorectal tissue comparison of the mean mtDNA mutation burden (± s.e.m.) as a function of the tissue metabolic signature. This plot illustrates the inverse correlation between the level of mitochondrial respiration and mutagenesis (linear regression with 95% confidence intervals, slope −10.17±0.9894, significance of non-zero slope P<0.0001, R2 = 0.71).

