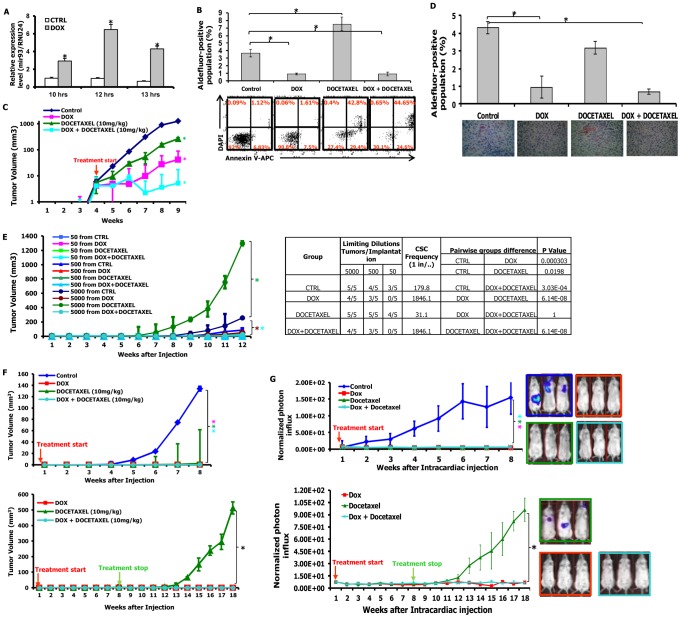
Figure 2. mir-93 inhibits tumor growth and metastasis by decreasing CSCs in SUM159 cells.
A. SUM159 cells were transduced with the pTRIPZ-mir-93 lentivirus and selected with Puromycin for 7 days. Tetracycline (DOX) induces mir-93 expression in suspension-cultured SUM159 cells by 10 hours; B. 1×10⁶ SUM159 cells or pTRIPZ-SUM159 -mir-93 cells were plated in T75 flasks and, after overnight, the cells were treated with Vehicle control, with (DOX) or without (CTRL) DOX (1 ug/ml), docetaxel (10 nM) or the combination for 7 days. Cells were utilized for Aldefluor assay and stained for Annexin V-APC and DAPI for apoptosis assay. C. 100 k pTRIPZ-SUM159-mir-93 cells were injected into the 4th fatpads of NOD/SCID mice. The treatment started as indicated by the red arrow. DOX alone (1 mg/ml in drinking water), or docetaxel (10 mg/kg i.p. once weekly) alone, or the combination inhibits SUM159 tumor growth in vivo (note: The Y-axis is on a logarithmic scale). D. Tumors from each group were collected. ALDH was accessed by the Aldefluor assay on viable dissociated cells and by ALDH1 immunohistochemistry on fixed sections. E. Serial dilutions of cells obtained from these xenografts were implanted in the 4th fatpads of secondary mice, which received no further treatment. F. 10k pTRIPZ-SUM159-mir-93 cells were injected into the 4th fatpads of NOD/SCID mice. The treatment started immediately after injection as indicated by the red arrow and stopped as indicated by the green arrow. G. 200k pTRIPZ-SUM159-mir-93-Luc cells in 100 ul of PBS were injected into the left ventricle of NOD/SCID mice. The treatment started immediately after injection as indicated by the red arrow and stopped as indicated by the green arrow. Metastasis formation was monitored using bioluminescence imaging. Quantification of the normalized photon flux, measured at weekly intervals following inoculation. *p<0.05; Error bars represent mean ± STDEV. The colored “*” on the side of the tumor growth curve indicates that the tumor growth or metastasis is significantly different between the control group and the group with the same colored curve.

