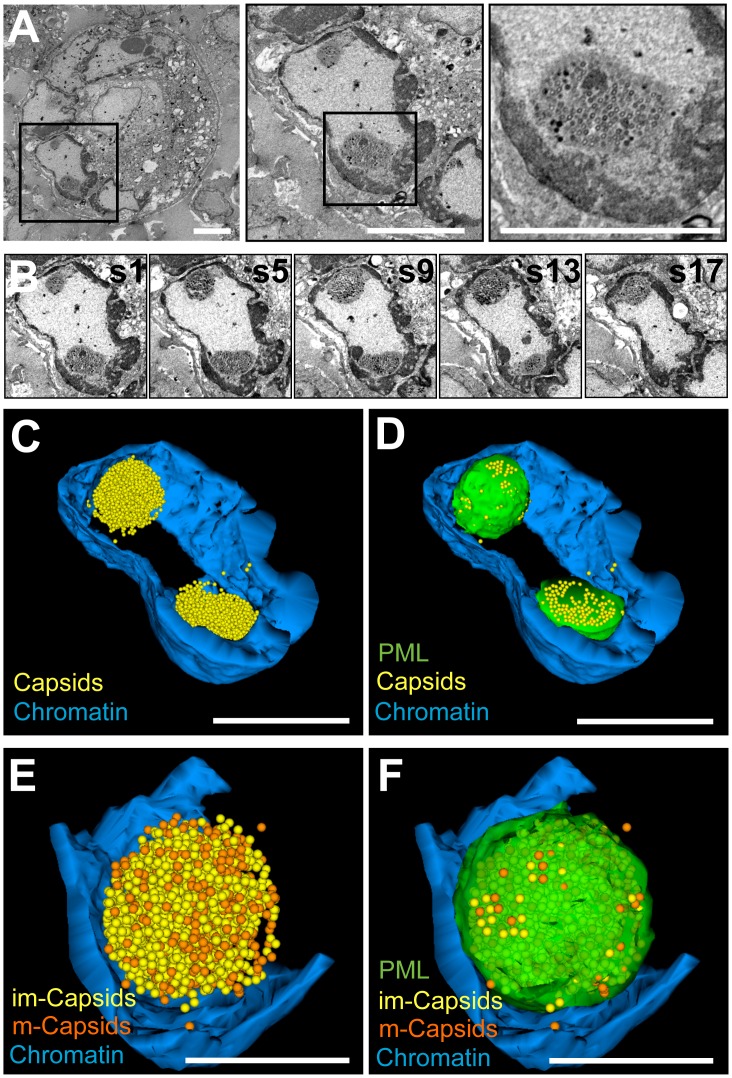
Figure 4. Three-dimensional distribution of VZV nucleocapsids in host cell nuclei with PML cages.
Melanoma cells that express doxycycline-induced PML IV were infected with VZV for 48 h and processed for BSE-SEM imaging. (A) BSE-SEM images at different magnifications of a syncytium of VZV infected melanoma cells. Left panel: low magnification view of a syncytium; middle panel: one nucleus of the same syncytium with two PML cages; right panel: higher magnification view of a PML cage with sequestered VZV capsids. Black squares indicate areas that are shown at higher magnification in the panels to the right. Scale bars are 5 µm. (B) Five representative images (s1, s5, s9, s13, s17) from a series of 18 consecutive sections through the nucleus shown in A, middle panel. See also Video S4. (C and D) 3D models based on tracing and segmentation in all 18 sections of electron dense heterochromatin (blue); nucleocapsids (yellow spheres) and PML cages (green, shown only in D). 1,732 and 1,324 capsids were identified in the upper and lower PML cage, respectively). Scale bars are 5 µm. See also Video S5. (E and F) 3D models of the upper PML cage. Color code as above, but immature capsids (A and B-type capsids) are shown as yellow spheres and mature capsids (C-type) in orange; the PML cage is transparent green (shown only in F). Scale bars are 2 µm.

