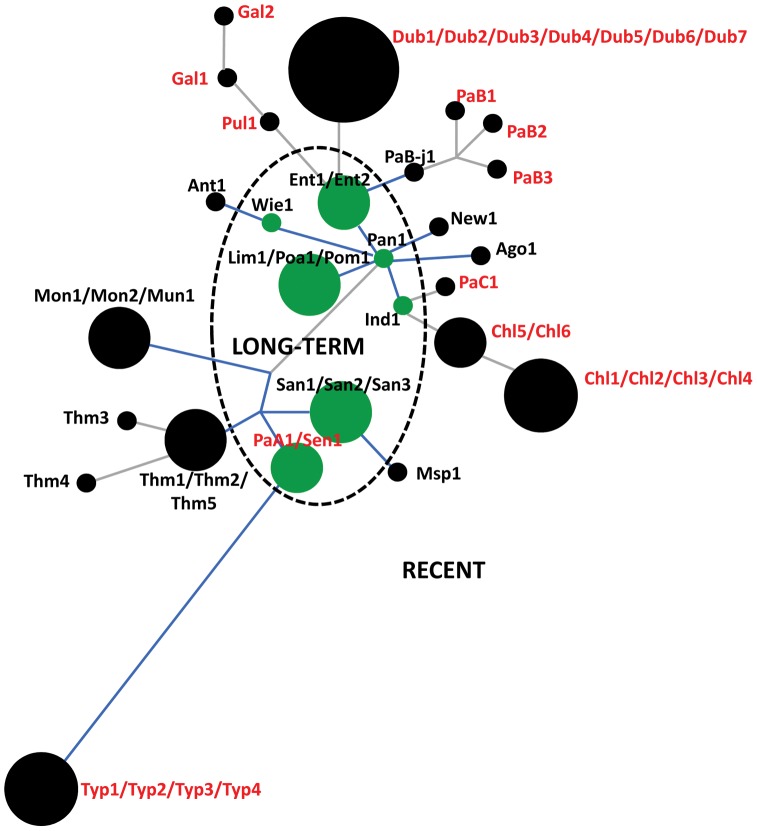
Figure 3. DNA-based protein phylogram of S. enterica FimH, derived from ZP analysis.
The tree was built based on the 50 fimH sequences of S. enterica subsp. I. Each circle represents a unique structural variant, and the size of the circle is proportional to the number of representative sequences. The dashed line separates the long-term (green) from the recently emerged variants (black). Branches marked in blue indicate branches containing synonymous mutations. The length of each branch is proportional to the number of non-synonymous mutations that were acquired. The strain tags of systemically invasive serovars are in red and the non-invasive serovars in black.

