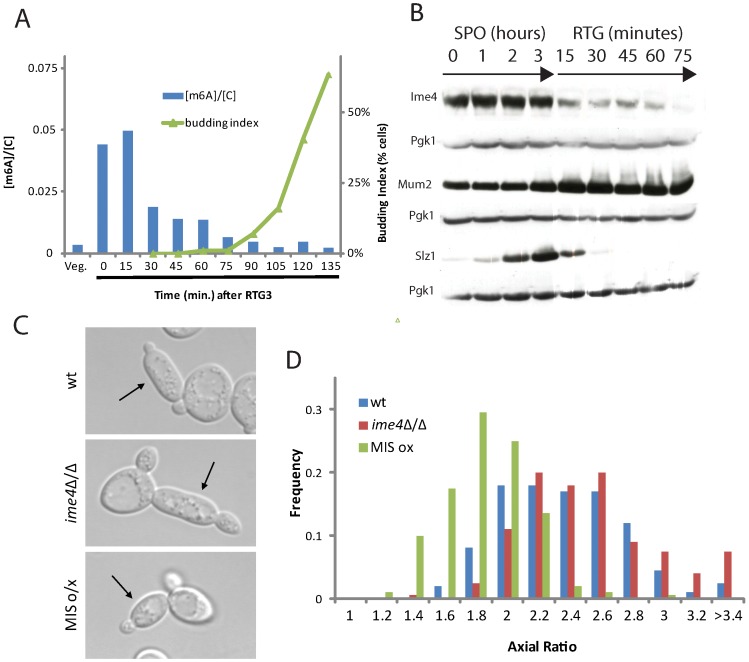
Figure 7. m6A formation inhibits filamentation.
A) Quantification of m6A abundance relative to cytosine (blue bars, left axis) and budding index (green triangles, right axis) upon RTG3. B) Western analysis for 3x-myc-tagged Ime4 protein (SAy914), 3x-HA-tagged Mum2 protein (SAy1235) or 3x-HA-tagged Slz1 protein (SAy1254) throughout RTG3 (i.e., following the shift to YPD after 3 hours in SPO); Pgk1 protein serves as loading control. C) Representative images of cells from wild-type (SAy821), ime4Δ/Δ (SAy771) and a strain induced to express the three components, IME4, MUM2 and SLZ1 (SAy1248) from PCUP1 after RTG3. All strains were treated with cupric sulfate upon RTG3 into YPD. D) Axial ratio quantifications of RTG3 cells from cells in (C) (n = 200 cells/strain).

