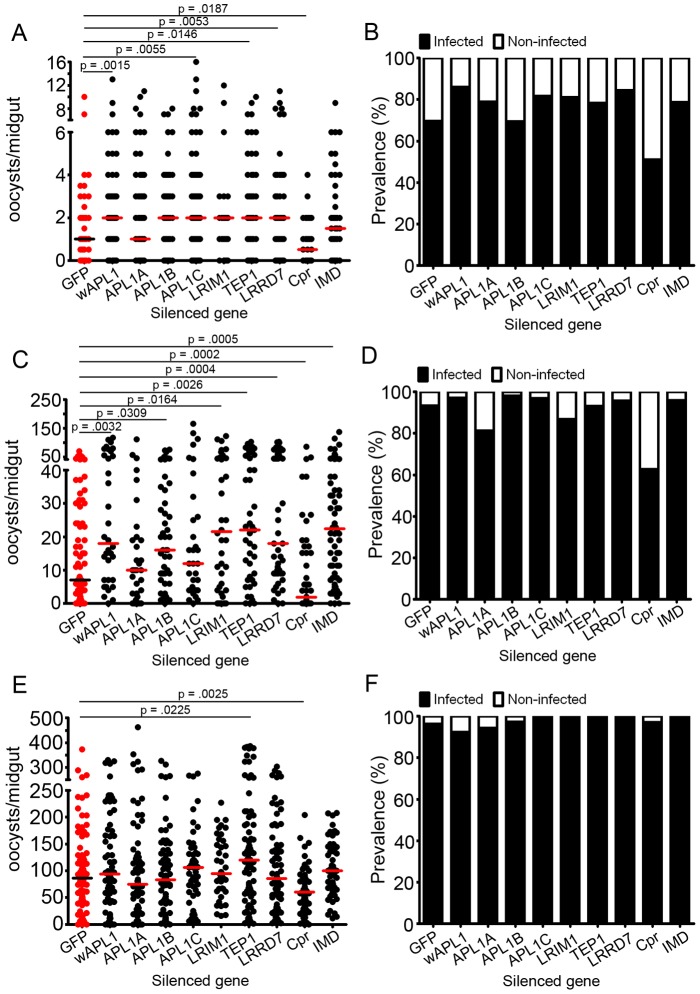
Figure 5. Imd pathway components and effectors differ in their ability to affect P. falciparum infections of high, medium, and low infection intensities.
Intensity of P. falciparum oocysts in A. gambiae silenced for given genes and subjected to low (A), medium (C) or high (E) infection exposures. Bars represent median numbers of oocysts per midgut, and dots represent individual midgut oocyst counts. Assays represent at least three independent biological replicates and were subject to Mann-Whitney statistical tests. P-values appear above each treatment and refer to that treatment as compared to the GFP dsRNA-treated control. Non-significant p-values were not included in the figure. Additional statistical analyses appear in Table S4. D-F: Prevalence of infection in A. gambiae subjected to low (B), medium (D) and high (F) loads of P. falciparum. Filled portion of bars represent the % of all mosquitoes harboring at least one oocyst; open portion represents those in the group that were uninfected. wAPL1 (whole APL1) dsRNA – dsRNA for a conserved region of APL1 genes, which results in the silencing of all three APL1 proteins (APL1A, APL1B and APL1C).

