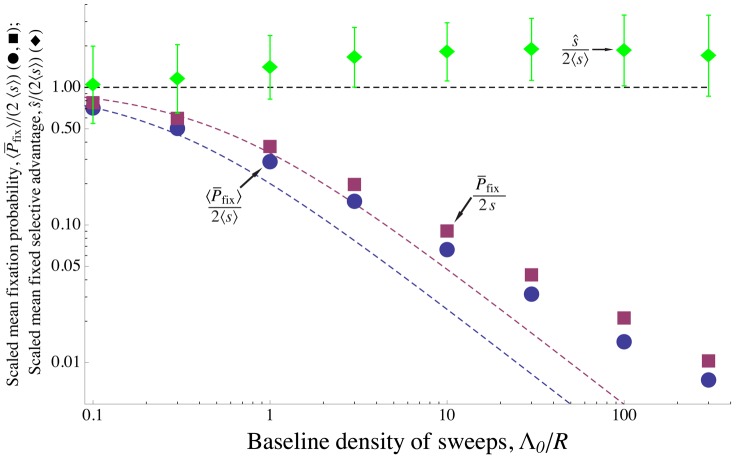
Figure 7. Effect of interference among alleles with a distribution of selective advantages.
Simulation results for scaled mean probability of fixation  for mutations with exponentially distributed selective advantages (blue circles) and scaled mean selective advantage for successful mutations
  (green diamonds), as a function of the baseline density of sweeps
  – i.e., the amount of interference. The purple squares shows
  for the same parameter values, but with all mutations conferring an identical selective advantage
  . Allowing for a distribution of selective effects makes little difference in the rate of sweeps,
  , and the mean selective advantage of sweeps stays close to
  (dashed black line), even for strong interference. The theoretical predictions Eqs. (7) and (13) (purple and blue dashed curves, respectively) are accurate for weak interference, but underestimate fixation probability with strong interference. The mutation rate
  is varied, with other parameters held constant at
  ,
,  , and mean selective advantage provided by a mutation
  . All points are averages over 5000 simulated generations. Error bars on the top curve show the standard deviation of
  for successful mutations. The standard errors are less than the size of the points.

