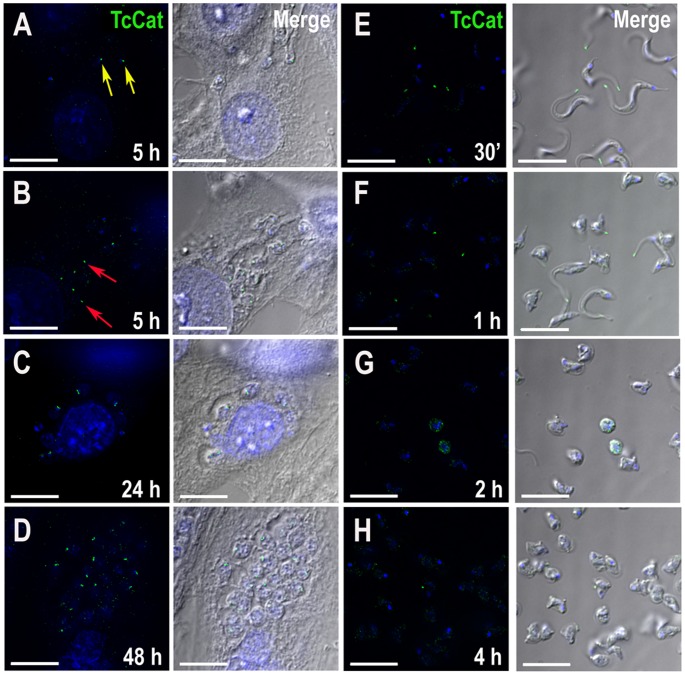
Figure 2. Changes in TcCat localization during differentiation.
TcCat immunolocalization (green) at different time points after mammalian cell infection (A–D) or during in vitro differentiation of trypomastigotes to amastigotes at acidic pH (E–H). Yellow arrows indicate trypomastigote-like morphology and red arrows indicate amastigote-like forms at 5 h post-infection. Nuclei were DAPI stained (blue). Bars = 10 µm.

