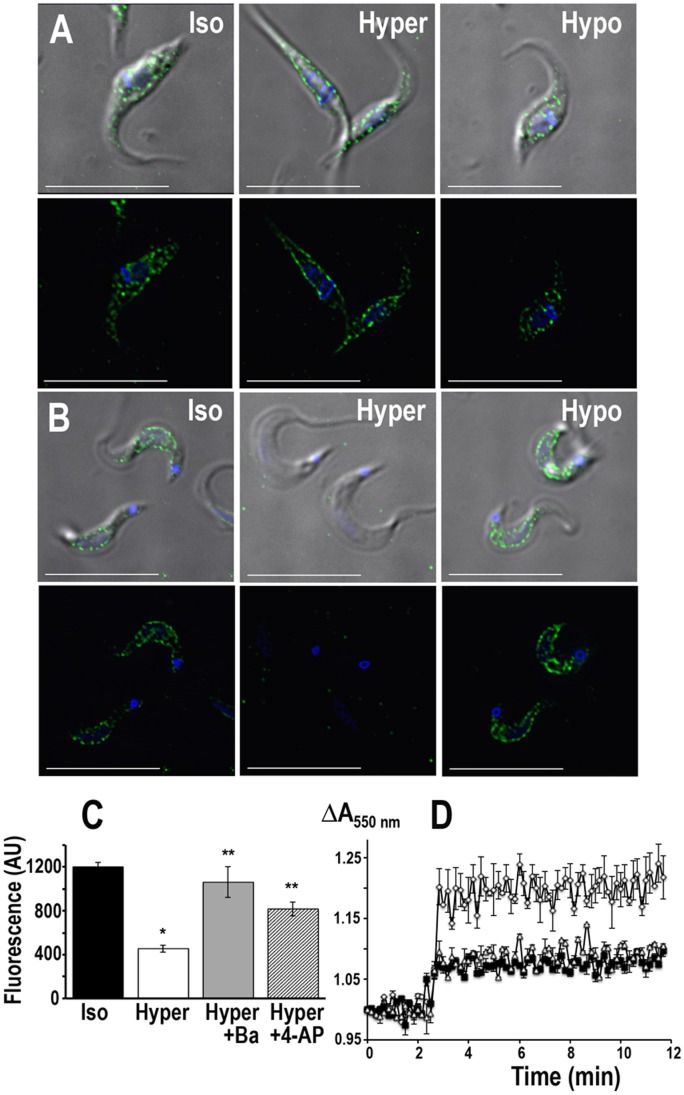
Figure 7. Osmotic stress effect of TcCat localization.
TcCat immunolocalization in T. cruzi epimastigotes (A) and trypomastigotes (B) under isosmotic (Iso), hyperosmotic (Hyper) or hyposmotic (Hypo) conditions. TcCat was detected with purified specific antibody and secondary anti-rabbit Alexa-488 conjugated (green). DNA was stained with DAPI (blue). Bars = 10 µm. C. Quantification of the TcCat label intensity in trypomastigotes under isosmotic or hyperosmotic conditions. Values are expressed in arbitrary units (AU) as mean ± SEM of n = 3 independent experiments. For each experiment and treatment, the pixel intensity of 75 parasites was measured. *P<0.01 respect to the isosmotic condition. **P<0.01 respect to hyperosmotic in the absence of the blockers. D. Relative change in trypomastigotes cell volume under hyperosmotic stress (control, open diamonds). TcCat blockers significantly reduce the shrinkage (1 mM BaCl2 open triangles; 100 µM 4-AP, black squares). Values are mean ± SEM of n = 3 independent experiments.

