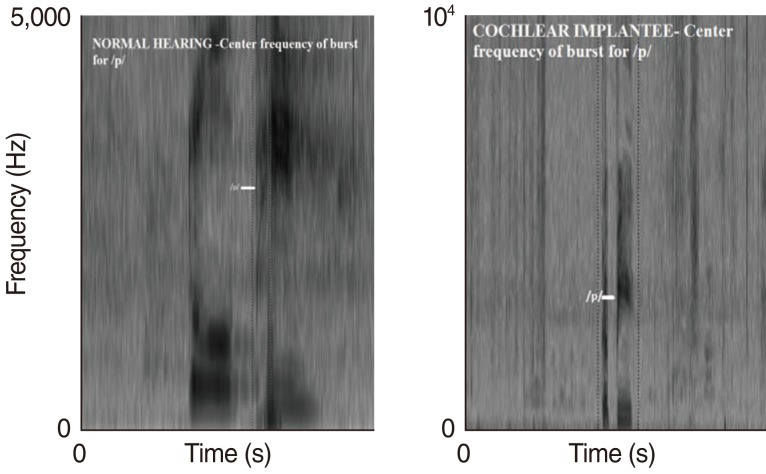
Fig. 5.
Spectrograph depicting center frequency of the burst for /p/ (Hz) of normal hearing peers and cochlear implantees. The above spectrograph shows center frequency of burst for /p/ (Hz) of one single normal hearing subject and one single cochlear implantee and does not include specific numerical values.

