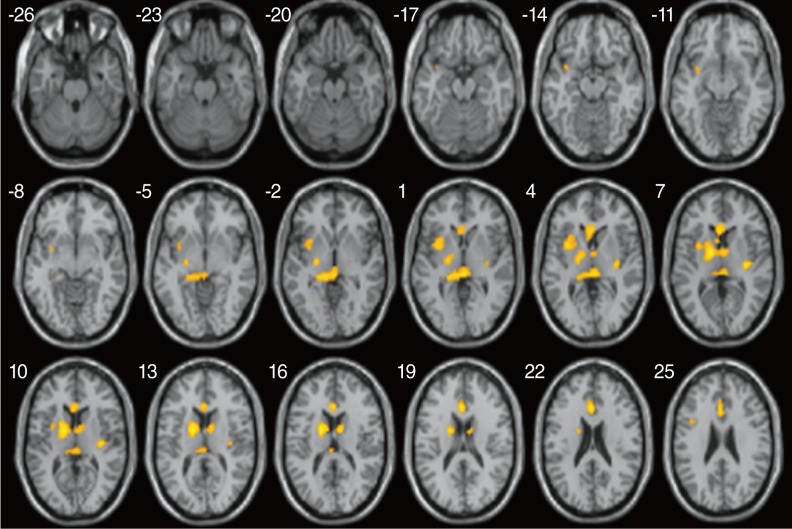
Fig. 1.
Two sample statistical parametric mapping (SPM) axial maps rendered on to a normalized T1-weighted MR image, shows areas of significant decrease in fractional anisotropy (FA) values in poor outcome subjects compared to good outcome subjects (thresholded at uncorrected P<0.0005 and the extent of 16 clusters).

