
Figure 3.
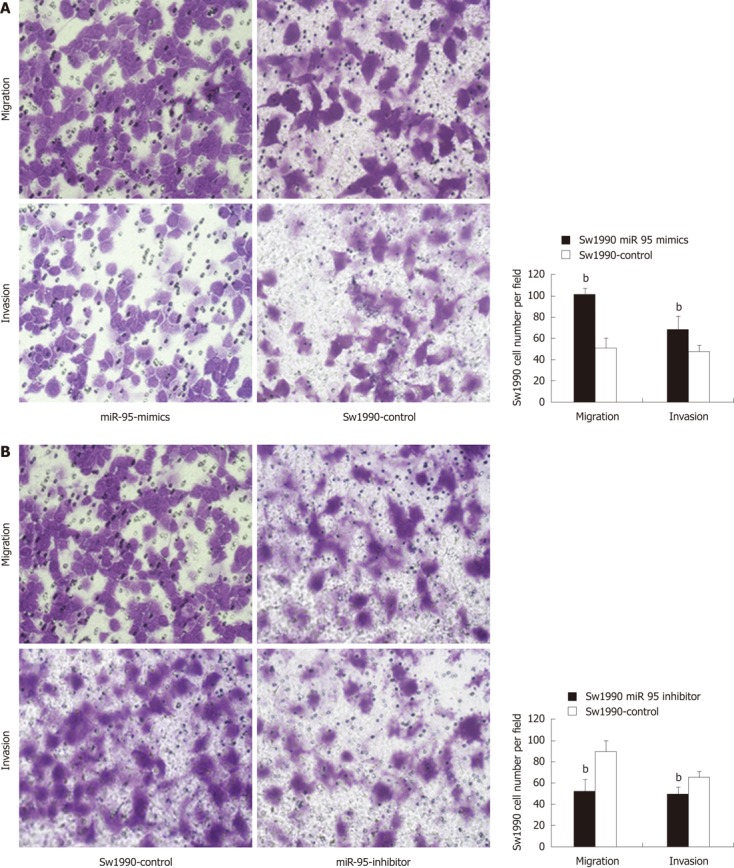
Effect of miR-95 on tumor cell migration, invasion of Sw1990 cells. A: Invasion and migration assay. Representative fields of invasion (down) or migration (up) cells on the membrane (left, magnification of × 200). Average invasion or migration cell number per field (right). The invasion or migration cell number of Sw1990 transfected with miR-95-mimics drastically increased than that transfected with pairing negative control; B: The invasion or migration cell number of Sw1990 cells transfected with miR-95-inhibitor dramatically decreased than that transfected with pairing negative control. bP < 0.01 vs Sw1990-control, n = 10.