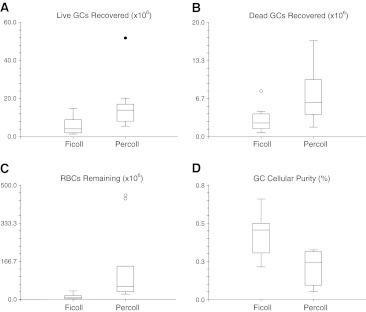
Fig. 1.
a–dT-test comparison of samples purified with Ficoll and Percoll: a number of live granulosa cells (GCs) recovered, p = 0.022; b number of dead GCs recovered, p = 0.011; c number of RBCs remaining, p = 0.021; d GC purity [Total GCs/(Total GCs + RBCs)], p = 0.00058. Mild outliers are denoted with an open circle (in B and C), and a severe outlier (in A) is noted with a solid circle. Significance for differences set at p < 0.05

