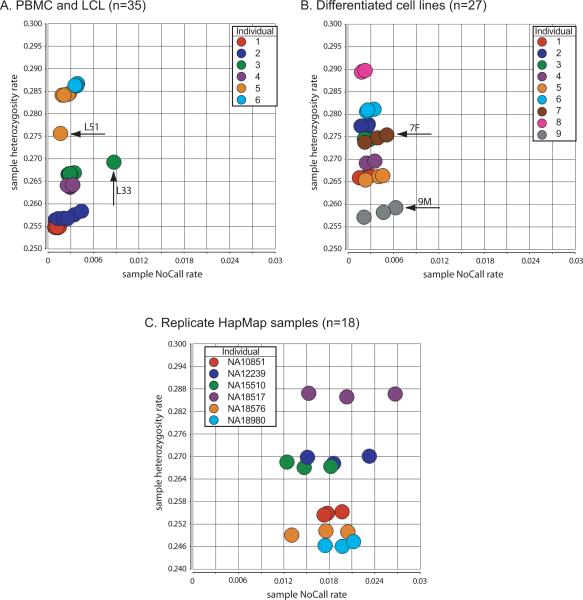
Figure 1.
Plots of heterozygosity versus NoCalls. We measured sample heterozygosity rates (y-axis) compared to sample NoCall rates (x-axis) for (A) Coriell PBMC and LCL samples, (B) Coriell differentiated cell lines, and (C) HapMap replicate samples. Several outliers are indicated, having relative differences in heterozygosity and/or NoCall rates.

