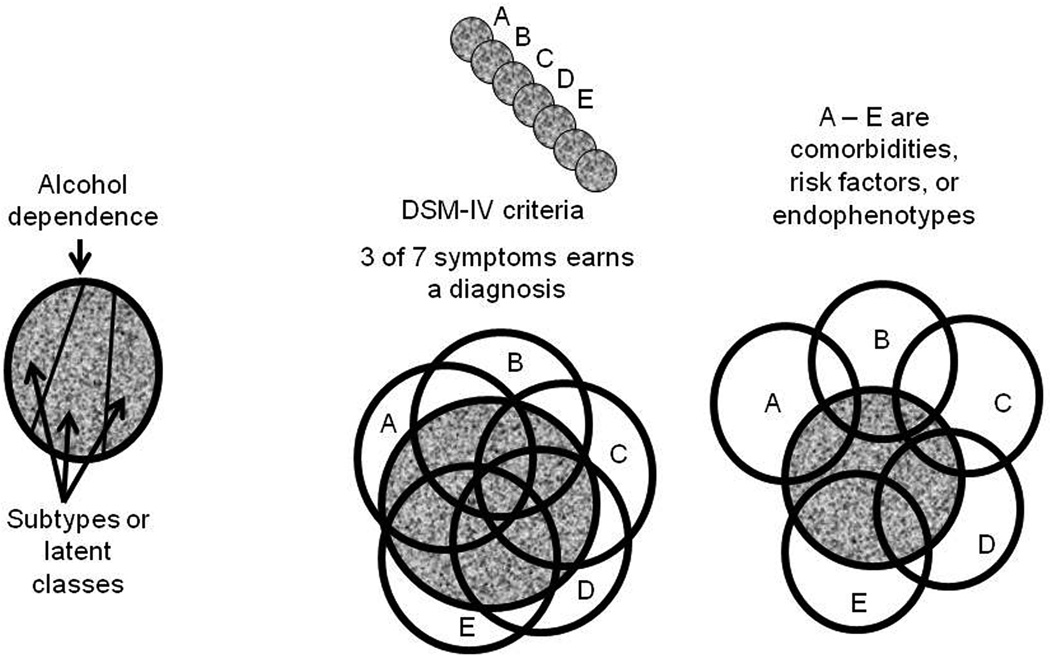
Figure 1.
Three ways to partition the construct represented by a diagnosis of alcohol dependence (AD), represented by the gray space. The left panel represents a case where three distinct and independent subtypes might exist. These could emerge as latent classes from clusters of symptoms or traits. Such a clear result is unlikely to occur. The middle panel depicts how multiple traits (A – E) might interact with AD. The circles represent the individual variabilities associated with each trait, and their overlap with each other and with AD indicate covariance. Here, A – E might represent 5 of the 7 symptoms used by the DSM-IV to assign diagnosis. Each symptom covaries substantially with AD and tends to covary with most other symptoms. Finally, the right panel depicts a more realistic pattern of covariances for such things as comorbidities, risk markers, and endophenotypes. The traits differ in the proportion of covariance shared with AD (for C a little, for E a lot). E covaries with AD independently from A, B, and C, but shares some covariance with both D and AD. Most of the covariance between D and E is also shared with AD, while most of the covariance between B and C is independent of AD.

