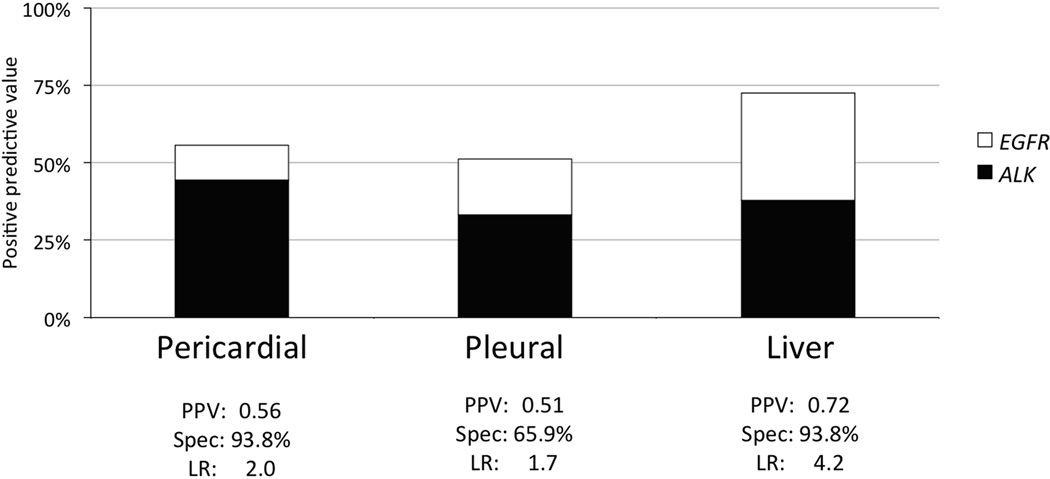
Figure 4.
Positive predictive value (PPV) and the contribution of EGFR (open) and ALK (filled) are shown in the bar graph. Also displayed are the specificity and likelihood ratio (LR) for the presence of an actionable gene alteration in EGFR or ALK given known metastases to the pericardium, pleura or liver.

