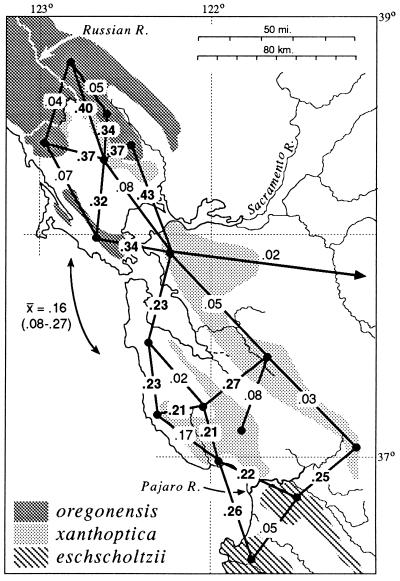
Figure 2.
Distribution of taxa of Ensatina in the San Francisco Bay region, showing D (21) based on allozyme data between selected neighboring populations. Bold face type, D between taxa; normal type, D within taxa. The mean and range of D between North Bay and South Bay oregonensis is shown.

