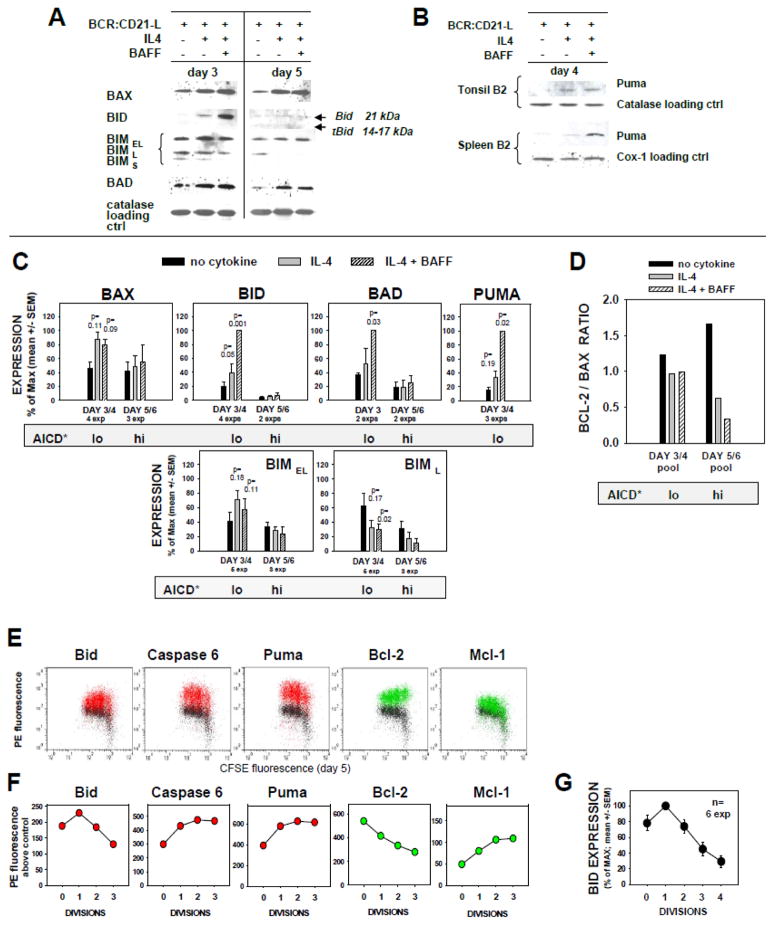
FIGURE 2. Profile of pro- and anti-apoptotic molecules displayed in BCR:CD21-L triggered B cells receiving co-stimuli from IL-4 ± BAFF.
(A–D) Immunoblotting analyses of SDS-PAGE separated proteins in lysates of human FO cells cultured for 3–4 d or 5–6 d with BCR:CD21-L and medium, IL-4, or IL-4 + BAFF. (A) Lysates from a representative single experiment were analyzed for Bax, Bid, Bim, and Bad by sequential stripping and reblotting. In this experiment, d3 and d5 lysates were contemporaneously transferred to different blots, with subsequent simultaneous analysis. (B) Immunoblots from 2 separate experiments evaluating Puma within day 4 lysates. (C) Pooled analysis of the relative expression of Bax, Bid, Bad, Puma, and BimEL and BimL isoforms, within multiple experimental lysates collected at day 3–4 (prior to AICD) and at day 5–6 (AICD evident). Within each experiment, densitometric data for expression of the test molecule and loading control protein was obtained; values for the given test molecule were standardized on the basis of loading control in each experiment and calculated as % of maximum observed; and finally, all the latter values were from multiple experiments are expressed as mean ± SEM. P values for significance from Student’s t test are shown. The shaded bar below each set of pooled data indicates the relative propensity of cultures to display AICD, as shown in Figure 1 and elsewhere (6). (D) Bcl-2/Bax expression ratios were obtained for the differing culture conditions by dividing the mean values for Bcl-2 expression (as % of max from a past analysis (6) of the same lysates here analysed for Bax) by the mean values (% of max) for Bax expression. (E–F) Immunocytofluorimetric analysis of selected pro-apoptotic and anti-apoptotic molecules within CFSE-labeled blasts in 5 day cultures activated by BCR:CD21-L + IL-4 + BAFF. (E) Following intracellular staining with mAb to intact Bid, Caspase 6, Puma (red), or Bcl-2 or Mcl-1 (green), or alternatively IgG control (black), viable-gated cells were analyzed for expression of each protein within cells of differing division status by two color flow cytometry. (F) Shown are the calculated values for PE fluorescence intensity above IgG control background, for each CFSE-determined division. (Results representative of a minimum of 3 exps). (G) Mean ± SEM of % of max values for Bid expression in diverse division subsets (n=6 experiments).

