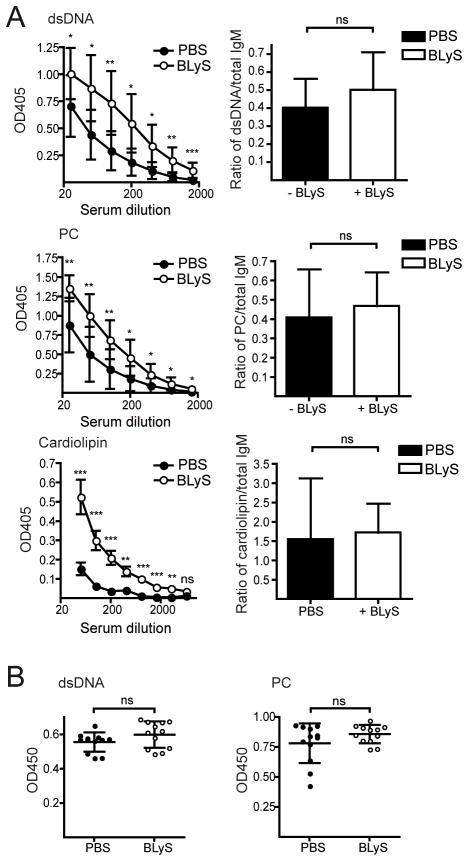
Figure 2. Effect of BLyS treatment on anti-dsDNA, anti-PC and anti-cardiolipin Ab levels in serum.
(A) IgM against dsDNA (top left panel), PC (middle left panel) and cardiolipin (lower left panel), in sera collected 1 day after the last day of PBS- or BLyS treatment. Ratio of anti-dsDNA IgM (at serum dilution 1:100), anti-PC IgM (at serum dilution 1:100) and anti-cardiolipin (at serum dilution 1:50) against total IgM (at serum dilution 1:4050) in serum at 1 day after the last day of PBS- or BLyS treatment (right panels). (B) IgM against dsDNA (left panel) or PC (right panel), in sera collected 19 days after the last day of PBS- or BLyS treatment. OD450 values at a serum dilution of 1:25 are shown. In (A) pooled data from two individual experiments are shown with a total of 9–10 mice/group. In (B), data from one experiment with 11–12 mice/group is shown. Diagrams show mean values ±SD. Statistical difference are shown as * for p-values ≤ 0.05, ** for p-values ≤ 0.01 and *** for p-values ≤ 0.001.

