Figure 1.
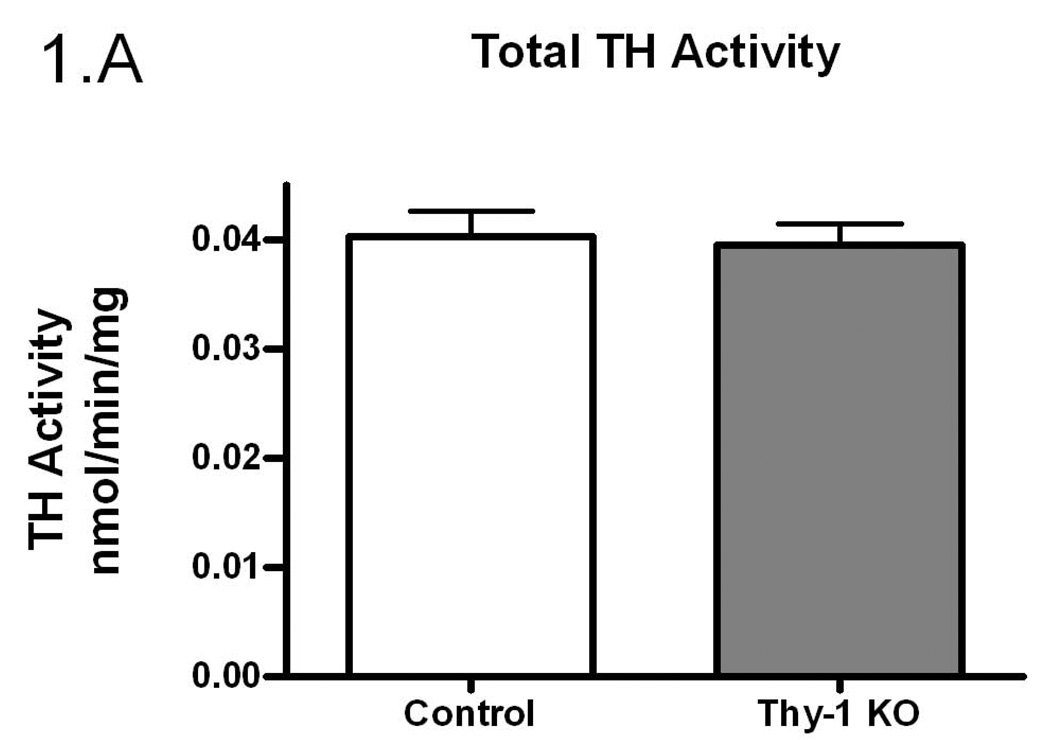
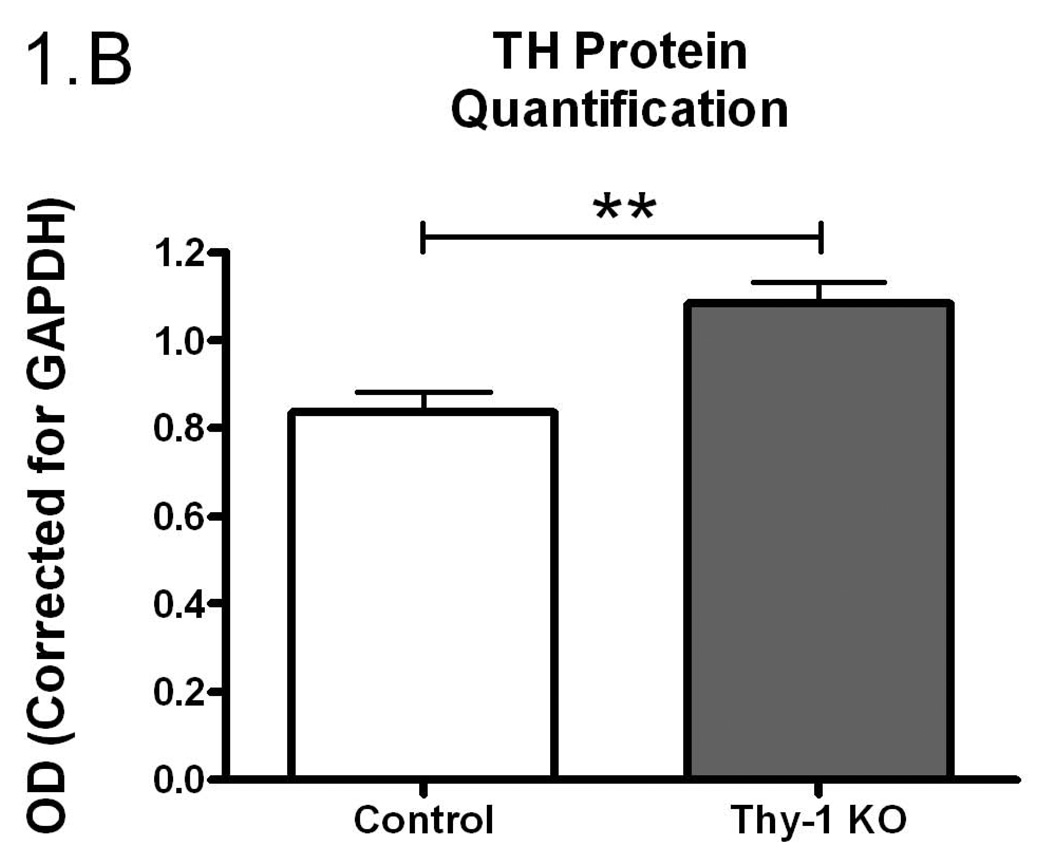
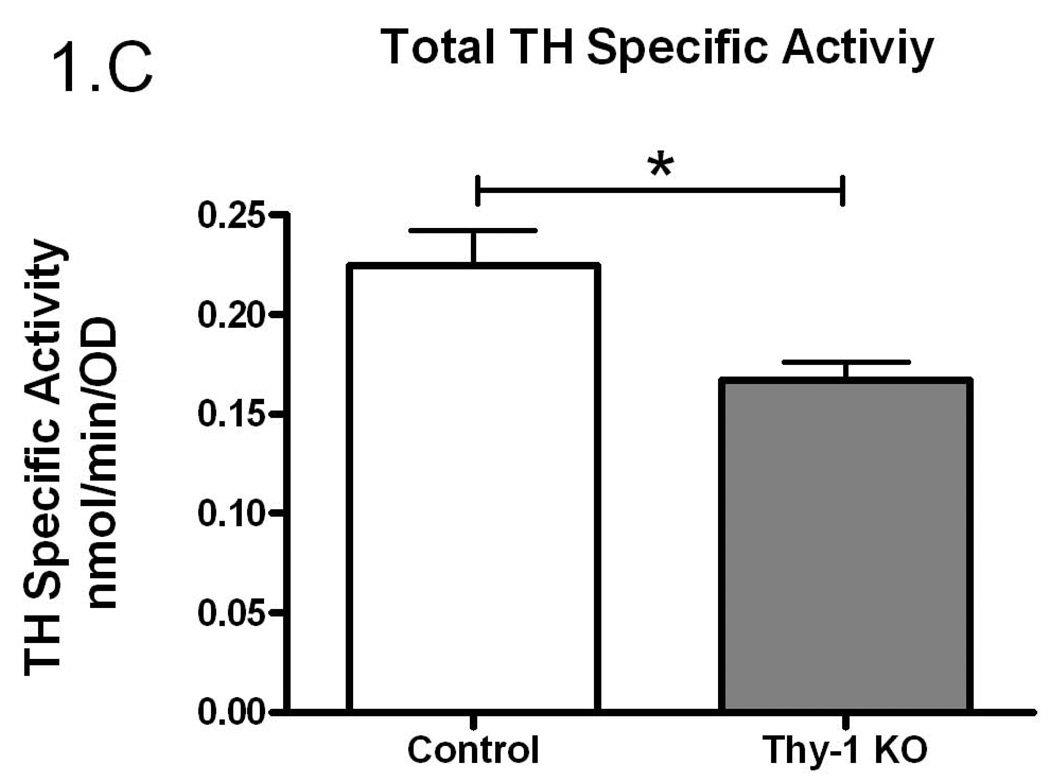
The amount of TH activity (A), TH protein quantification (B) and TH specific activity (C) in the striata of Thy-1 KO mice and controls were measured (as described in Methods). The results shown are the mean of 9 control (4 female; 5 male) and 9 Thy-1 KO (5 female; 4 male) animals. Results were analyzed using a GraphPad Prism5 student t-test. The error bars represent standard error of the mean. Statistical significance * p<0.05; ** p<0.01; *** p<0.001.


