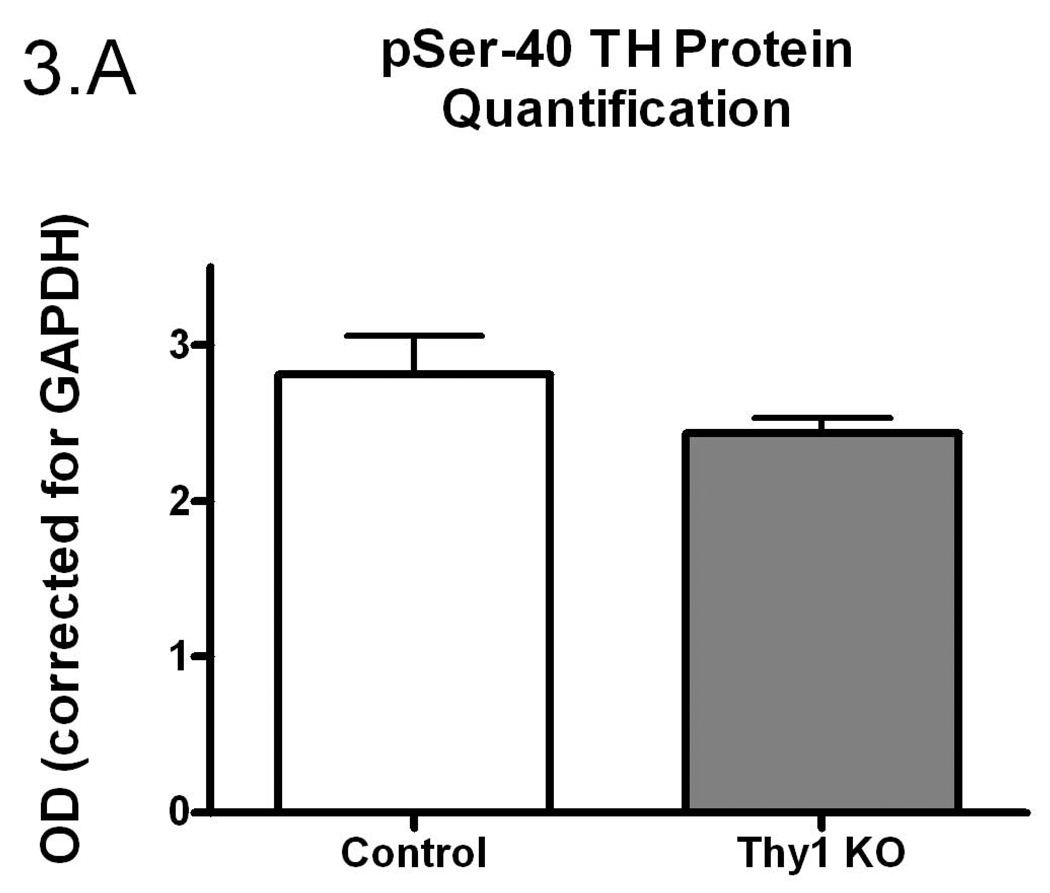
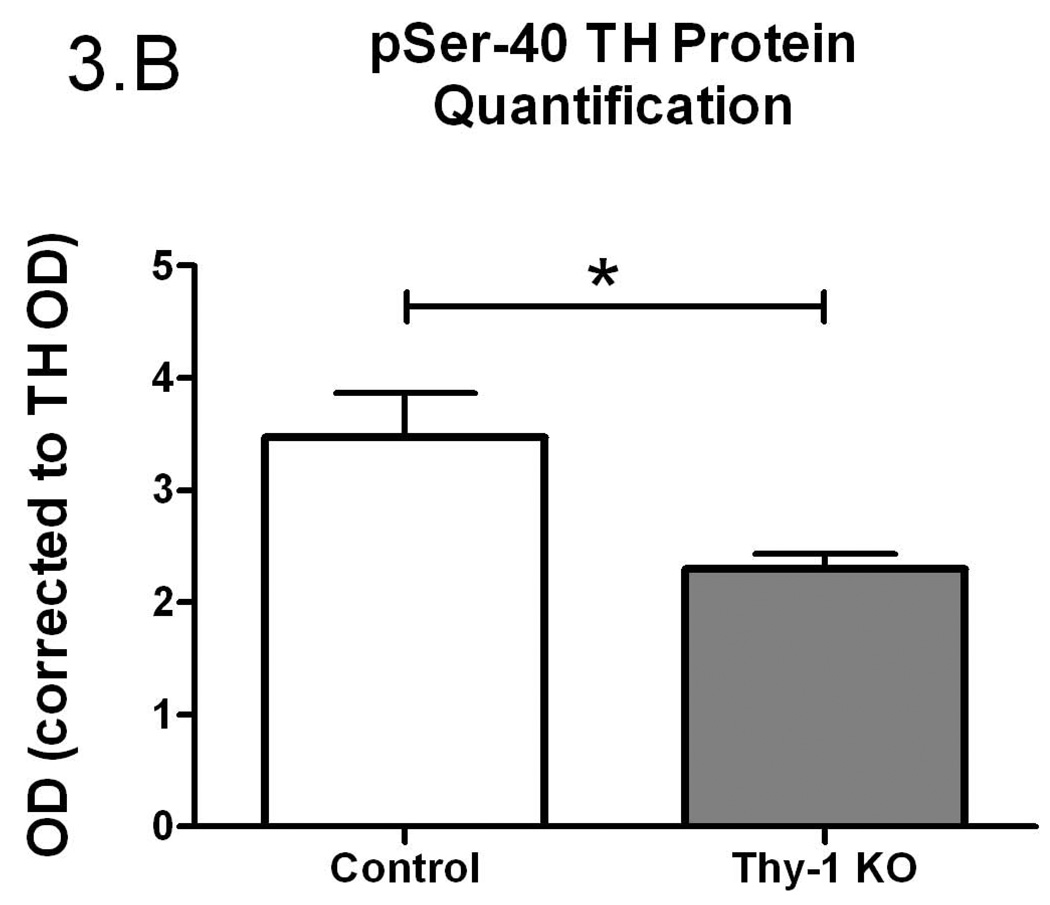
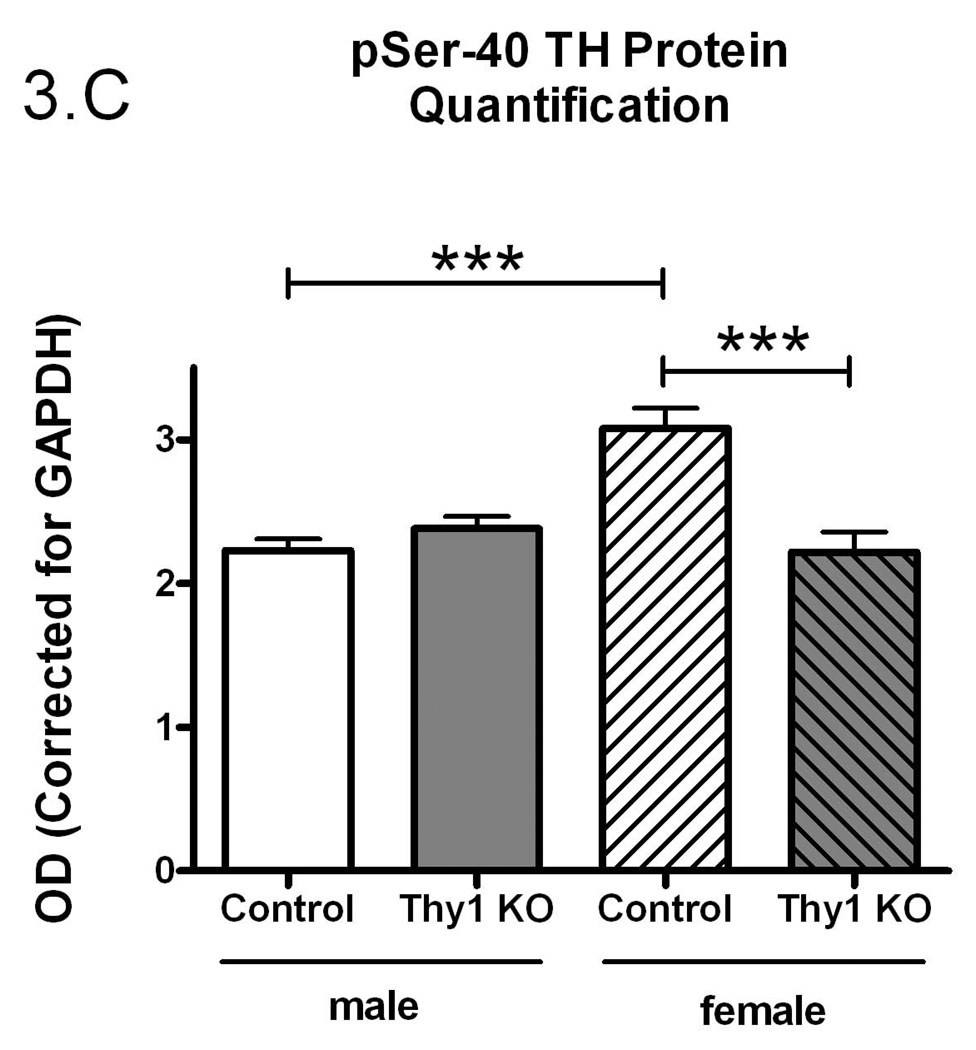
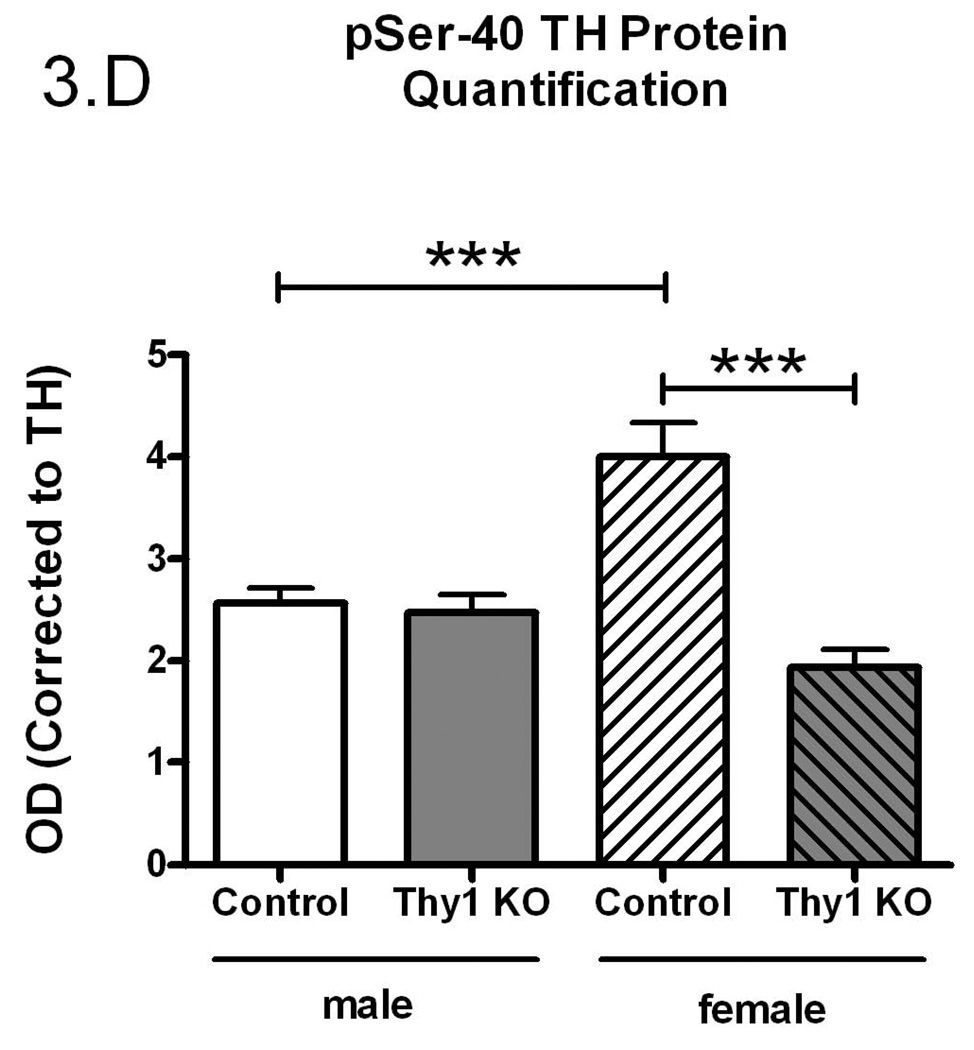
Figure 3.
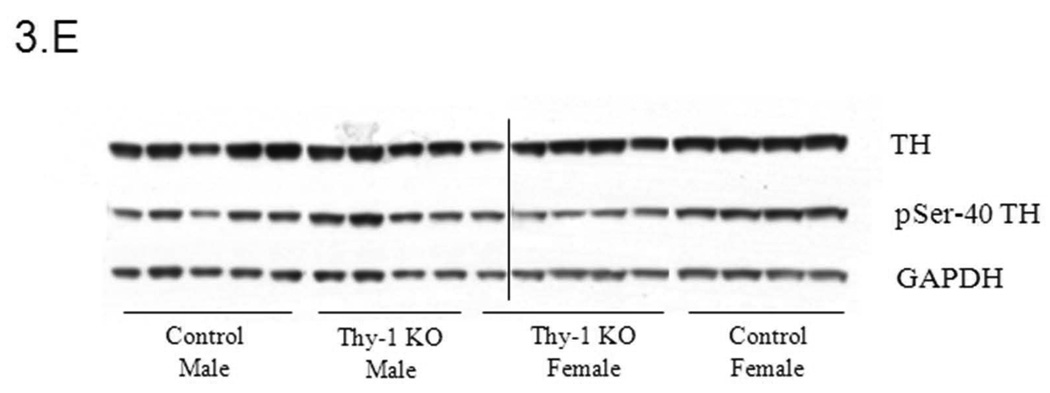
Phospho-serine-40 (pSer-40) TH protein quantification (A); Controls and Thy-1 KO pSer-40 TH protein quantification (corrected for GAPDH) (B); Controls and Thy-1 KO pSer-40 TH protein quantification (corrected to TH) (C); Gender-based pSer-40 TH protein quantification (corrected for GAPDH) Thy-1 KO (5 female; 4 male) and control (4 female; 5 male) mice, (D). Total TH, pSer-40 TH and GAPDH protein levels in striatal samples were determined by quantitative western blots. Results were analyzed by using one-way ANOVA followed by a Newman-Keuls post-hoc test. The error bars represent standard error of the mean. Statistical significance * p<0.05; ** p<0.01; *** p<0.001. Representative primary western immunoblot signals from two gels are provided in panel (E).

