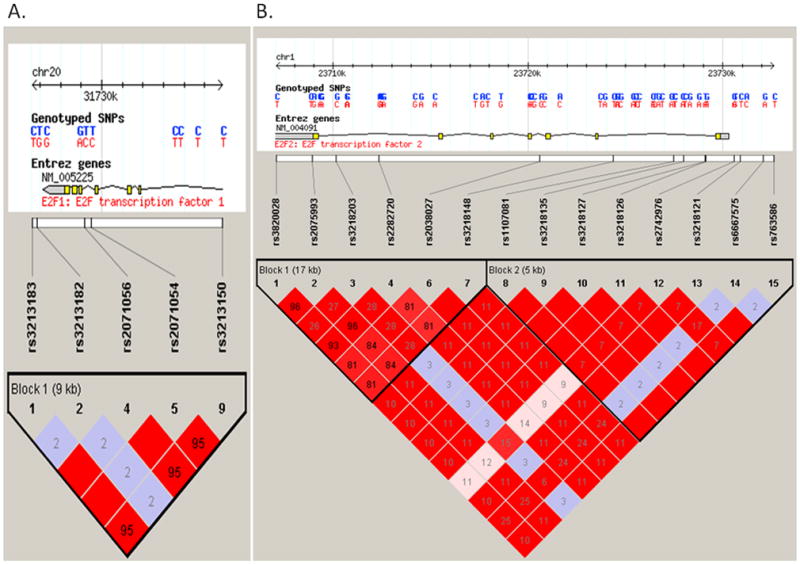
Figure 1.

The top panel shows the E2F1 (Figure 1A) and E2F2 (Figure 1B) gene region. The lower panel shows the linkage disequilibrium plot of the E2F1 and E2F2 region, using the CEU population from the International HapMap project. Each square number represents the pairwise r2 relationships between the relevant two SNPs.The color of each SNP spot reflects its D′ value, which changes from red to white as the D′ value decreases. The haplotype blocks were estimated with the program Haploview.The minor allele frequency of all above alleles are more than 0.05. Other selected functional alleles predicted in our study rs3213180 in E2F1 and rs3218123, rs3218211 in E2F2 were not included in the International HapMap data.
