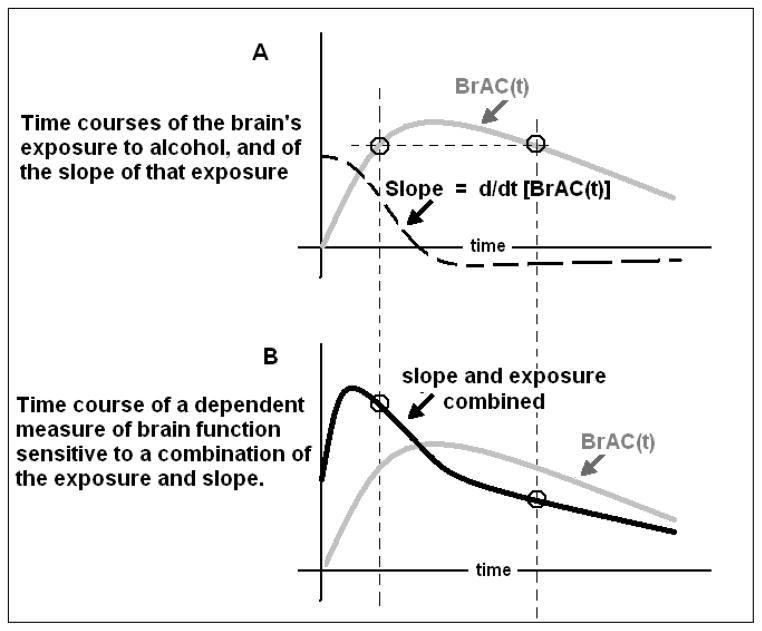
Figure 1.
A. Typical time course of the brain’s exposure to alcohol, BrAC(t), after ingestion of an oral bolus of alcohol (gray line), and the first derivative with respect to time (slope) of that exposure (dashed line). B. Repetition of the time course of a dependent measure of brain function if it changed only in proportion to the exposure (gray line), and the time course of a measure that changes in proportion to a combination of the exposure and its slope (black line).

