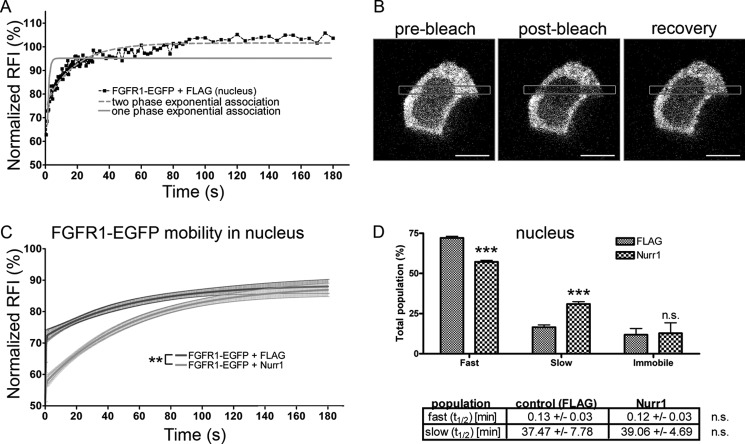
FIGURE 5.
FRAP of nuclear and cytoplasmic FGFR1-EGFP in neuroblastoma cells after co-transfection with Nurr1. A, one (gray line) and two exponential (gray dotted line) regression curves for data from one exemplary FRAP measurement in the nucleus of neuroblastoma cells transfected with FGFR1-EGFP. The regression analysis of recovery kinetics showed the best fit with a two exponential function. B, example of a single cell before and after photobleaching. Scale bar, 10 μm. C, after fitting two-exponential curves to FGFR1-EGFP, the recovery kinetics were significantly changed in the nucleus of neuroblastoma cells co-transfected with Nurr1–3×FLAG (n = 10). D, a significant shift of FGFR1-EGFP mobility was represented by a significant) decrease of the fast and a significant increase of the slow population in the nucleus of cells co-expressing Nurr1–3×FLAG compared with control cells co-expressing 3×FLAG. ***, p < 0.001. Recovery half-time (t½) values were not significantly altered (n.s., nonsignificant).

