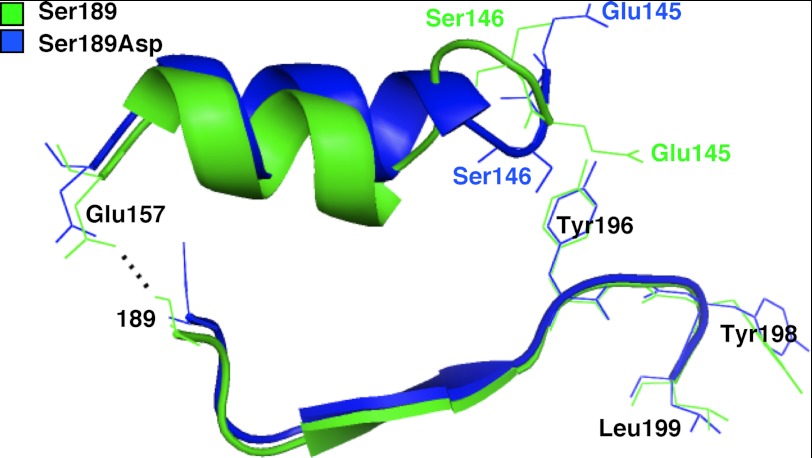
FIGURE 3.
Chain of conformational change associated with ligand inhibition. Schematic views of the α2-helices and β2-strands in PDZ2 of GRASP55(1–208) S189D (blue) and GRASP55(1–208) (green) are aligned. The view shown highlights the bond disrupted by the S189D substitution (dotted black line), the shift in the α2-helix, and the reversals in the positions of Glu-145 and Ser-146 that correlate with the shift in position of the neighboring Tyr-198 in the internal ligand.

