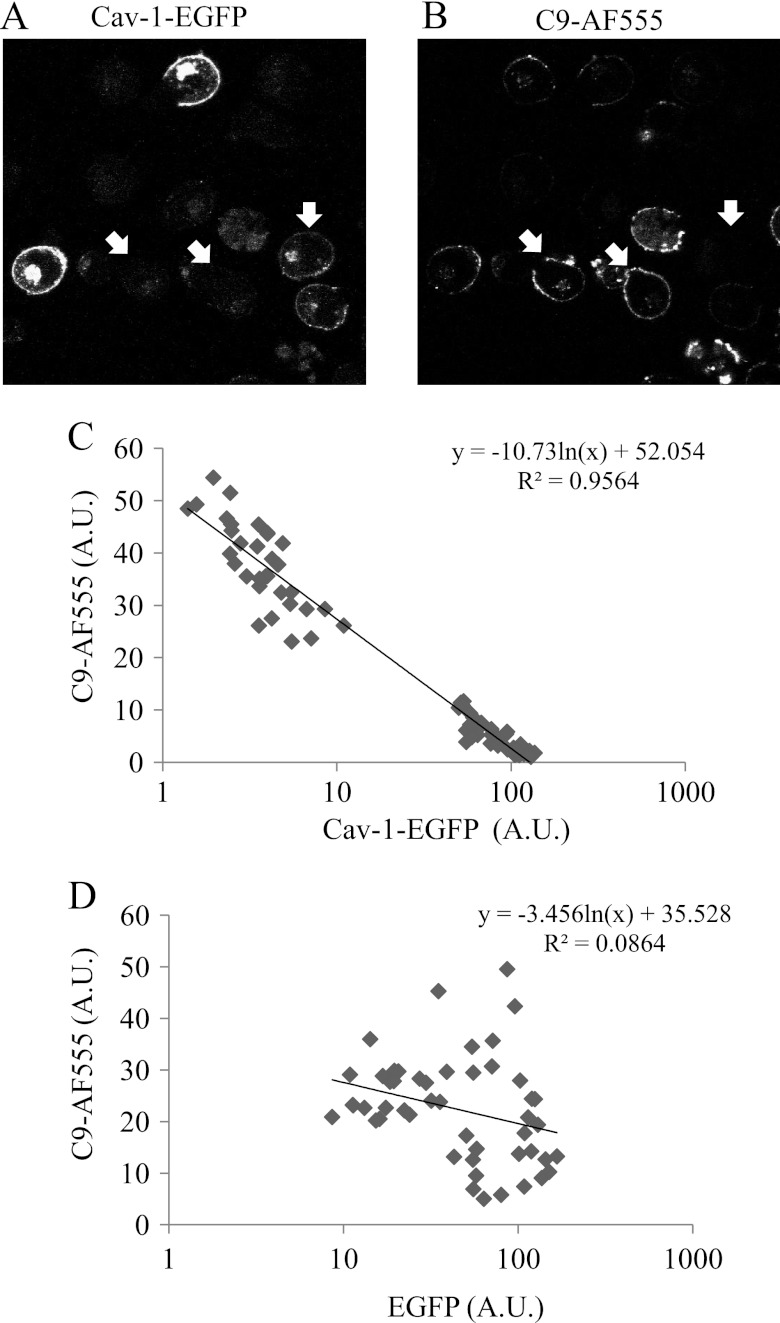
FIGURE 7.
MAC deposition is inversely correlated with the level of Cav-1-EGFP expression. A and B, K562 cells were transfected with Cav-1-EGFP plasmid or EGFP plasmid as control. After 48 h, the cells were treated with a sublytic dose of anti-K562 antibodies and then with C9D-NHS supplemented with C9-AF555 for 10 min at 37 °C. Next, the cells were washed and analyzed under a confocal microscope. A selected image representing numerous similar images is shown in A and B. White arrows point at 3 cells showing low levels of Cav-1-EGFP and high levels of C9-AF555. C and D, amounts of C9-AF555 and Cav-1-EGFP or EGFP (A.U.) were quantified with the Image J software in 80 randomly selected cell images. C, a significant inverse correlation is shown between the quantities of C9-AF555 and Cav-1-EGFP (R2 = 0.9564; p < 0.05). D, no correlation is seen between the levels of C9-AF555 and EGFP (R2 = 0.0864).

