Background: FGFR1c and KLB form an ill-defined FGF21 signaling complex.
Results: FGFR1c competes with galectin for binding to KLB. KLB and FGFR1c interact in a 1:1 heterocomplex, and subsequent addition of FGF21 induces FGFR1c dimers.
Conclusion: KLB and FGFR1c activity and dynamics suggest that the galectin lattice modulates FGF21 signaling.
Significance: The galectin lattice is a novel target to potentiate therapeutic effects of FGF21.
Keywords: Fibroblast Growth Factor (FGF), Fibroblast Growth Factor Receptor (FGFR), Fluorescence, Galectin, Receptor Tyrosine Kinase, FGF21, FRAP, KLB, Number and Brightness Analysis, Galectin
Abstract
FGF21 stimulates FGFR1c activity in cells that co-express Klothoβ (KLB); however, relatively little is known about the interaction of these receptors at the plasma membrane. We measured the dynamics and distribution of fluorescent protein-tagged KLB and FGFR1c in living cells using fluorescence recovery after photobleaching and number and brightness analysis. We confirmed that fluorescent protein-tagged KLB translocates to the plasma membrane and is active when co-expressed with FGFR1c. FGF21-induced signaling was enhanced in cells treated with lactose, a competitive inhibitor of the galectin lattice, suggesting that lattice-binding modulates KLB and/or FGFR1c activity. Fluorescence recovery after photobleaching analysis consistently revealed that lactose treatment increased KLB mobility at the plasma membrane, but did not affect the mobility of FGFR1c. The association of endogenous KLB with the galectin lattice was also confirmed by co-immunoprecipitation with galectin-3. KLB mobility increased when co-expressed with FGFR1c, suggesting that the two receptors form a heterocomplex independent of the galectin lattice. Number and brightness analysis revealed that KLB and FGFR1c behave as monomers and dimers at the plasma membrane, respectively. Co-expression resulted in monomeric expression of KLB and FGFR1c consistent with formation of a 1:1 heterocomplex. Subsequent addition of FGF21 induced FGFR1 dimerization without changing KLB aggregate size, suggesting formation of a 1:2 KLB-FGFR1c signaling complex. Overall, these data suggest that KLB and FGFR1 form a 1:1 heterocomplex independent of the galectin lattice that transitions to a 1:2 complex upon the addition of FGF21.
Introduction
The fibroblast growth factor (FGF) family consists of 22 secreted polypeptides subdivided into 7 subfamilies based on phylogeny, sequence identity, and function (1, 2). FGF signaling is mediated at the cell surface by ligand binding to high affinity tyrosine kinase fibroblast growth factor receptors 1–4 (FGFR1–4)4 including a variety of FGFR1–3 isoforms due to mRNA splicing (3). The FGF19 subfamily (FGF15/19, FGF21, and FGF23) has recently emerged as a group of potent endocrine-like factors that vary in function from classical paracrine/autocrine FGFs. Specifically, FGF21 has shown pleiotropic function in regulating obesity and whole body glucose and lipid metabolism (4). Consistent with a significant role in regulation of metabolism, FGF21 is transcriptionally regulated by peroxisome proliferator-activated receptor-α (PPARα), an important regulator of lipid metabolism, (5, 6) and appears functionally independent of insulin (7). Due to these positive aspects, recombinant FGF21 is actively being explored as a therapeutic agent for metabolic syndrome (8).
FGF21 exhibits low affinity for heparin sulfate due to a modified β-trefoil structural motif (9, 10). This low affinity allows FGF21 to escape the heparin-rich cell matrix to affect distal tissues as an endocrine-like factor (11). The low affinity for heparin also precludes formation of a classical signaling complex involving FGF-bound heparin sulfate proteoglycans (HSPGs) and high affinity FGFRs. Rather, FGF21 signaling requires co-expression with Klothoβ (KLB), a member of the Klotho family, and either FGFR1c or FGFR2c (12, 13). FGFR1c and FGFR2c isoforms are expressed in a wide variety of tissues, meaning that the more defined expression of KLB effectively determines the specific tissue response to FGF21 (14). Furthermore, and consistent with a role in metabolism, KLB is expressed in metabolic tissues such as adipose tissue, liver, and pancreas (15).
KLB and FGFR1 appear to form a heterocomplex that is enhanced upon FGF21 ligand addition as determined by co-immunoprecipitation (16). This ligand-induced complex is likely stabilized by the C- and N-terminal ends of FGF21 binding to KLB and FGFR1, respectively (17, 18). Although very informative, these biochemical studies do not provide the spatiotemporal resolution to understand this signaling in the context of a living cell, nor do they give quantitative insight into the complex stoichiometry. To examine KLB dynamics in living cells, we created a fluorescent protein-tagged construct to be used with the complementary biophysical methods of fluorescence recovery after photobleaching (FRAP) (19) and number and brightness (N&B) analysis (20, 21). These methods allowed us to measure KLB receptor dynamics when co-expressed with previously characterized fluorescent protein-tagged constructs of full-length and kinase-deficient FGFR1c (22). Using these tools, we show that FGF21 signaling is modulated by interaction of KLB with the galectin lattice. We also measure receptor dynamics consistent with a preformed heterocomplex of the receptors as well as ligand-induced dimerization of FGFR1c.
EXPERIMENTAL PROCEDURES
Materials
BMHH imaging buffer (pH 7.4) contains 125 mm NaCl, 5.7 mm KCl, 2.5 mm CaCl2, 1.2 mm MgCl2, 10 mm HEPES, and 11 mm glucose. The fluorescent protein-tagged human full-length (pR1c-N1-Venus or Cerulean) and kinase-deficient (pKDR1c-N1-Venus or Cerulean) FGFR1c constructs were previously created and characterized (22).
Cell Culture
HeLa and HEK293T cells were maintained at subconfluence in full DMEM containing 10% fetal bovine serum and 5 units/ml penicillin-streptomycin. βTC3 cells were maintained at subconfluence in DMEM supplemented with 15% fetal horse serum, 2.5% fetal bovine serum, and 5 units/ml penicillin-streptomycin. All cells were maintained at 37 °C in humidified CO2.
Fluorescent Protein-tagged KLB Constructs
Human KLB (Invitrogen, MGC Accession no. BC103871) was modified to remove a HindIII site using paired primers (5′-GTCAGTGAGGGGCTGAAACTTGGCATCTCCGCGATG-3′ and 5′-CAGTCACTCCCCGACTTTGAACCGTAGAGGCGCTAC-3′) and subsequently cloned into the NheI and HindIII restriction enzyme sites of the pmVenus-N1 and pmCerulean-N1 vector using the following PCR cloning primers: 5′-CTAGCTAGCGCAAATGAAGCCAGGCTGTGC-3′ and 5′-CCCAAGCTTGCTAACAACTCTCTTGCCTTTC-3′. All constructs were sequenced to confirm identity.
Transient Transfection
HeLa and HEK293T cells were transiently transfected using polyethylenimine (PEI) transfection reagent (Polysciences Inc.) (23). A PEI-to-DNA mass ratio of 3:1 was used with a total of 2.0 μg of plasmid DNA for P35-sized MatTek glass bottom dishes or 6-well tissue culture-treated dishes. For dissolving the galectin lattice, HeLa cells were cultured in full DMEM + 20 mm lactose for 48 h prior to imaging. Recombinant human FGF21 (R&D Systems) was diluted in BMHH + 11 mm glucose + 0.1% BSA solution and added at a final concentration of 100 ng/ml immediately prior to imaging.
Immunoprecipitation
βTC3 cells were washed in PBS supplemented with 100 μm sodium orthovanadate and harvested by scraping. Cells were lysed in lysis buffer (1% Triton X-100, 100 mm sodium chloride, 50 mm HEPES, 5% glycerol, 1 mm sodium vanadate, and protease inhibitor mixture (Roche Applied Science)). Whole cell lysate protein concentration was determined by colorimetric protein assay (Bio-Rad Laboratories) using BSA as a standard. Whole cell lysate (500 μg) was precleared with 20 μl of protein A/G PLUS-agarose (Santa Cruz Biotechnology, Santa Cruz, CA) bead slurry for 30 min. Precleared lysates were mixed with mouse anti-galectin-3 antibody (2 μg) or normal mouse IgG for 2 h at 4 °C. Bead slurry (20 μl) was subsequently added and mixed overnight at 4 °C. The beads were washed three times with lysis buffer. Samples were eluted into SDS Loading Buffer (15 μl) of and analyzed by Western immunoblot.
Western Immunoblot
HeLa, HEK293T, or βTC3 cells were serum-starved in 0.2% fetal bovine serum, DMEM (11 mm glucose) overnight prior to stimulation with FGF-1 (10 ng/ml) or FGF21 (100 ng/ml). Whole cell protein lysates (10 μg/lane) or immunoprecipitates were separated by 7, 10, or 4–20% SDS-PAGE and transferred to Trans-Blot nitrocellulose membranes (Bio-Rad). Membranes were blocked by incubating with 2 or 5% nonfat dry milk powder, Tris-buffered saline-Tween 20 (TBS-T) (1 h at room temperature as per manufacturer's recommendations). Proteins of interest were detected by overnight incubation at 4 °C in either 5% BSA, TBS-T, 1% milk powder, TBS-T or 5% milk powder, TBS-T (as per manufacturer's recommendations) for the following polyclonal antibodies: phospho-p44/42 MAPK (Thr-202/Tyr-204) (Cell Signaling Technology, 1:1000), p44/42 MAPK (Cell Signaling Technology, 1:1000), or KLB (R&D Systems, Minneapolis, MN; 1:100). Blots were subsequently incubated with horseradish peroxidase-conjugated goat anti-rabbit IgG (Southern Biotechnology Associates, Birmingham, AL; 1:5000), horseradish peroxidase-conjugated anti-goat IgG (eBioscience, San Diego, CA; 1:1000), or anti-rabbit horseradish peroxidase-linked antibody (Cell Signaling Technology; 1:2000) diluted in 5% milk, TBS-T (45 min at room temperature), and proteins were detected by enhanced chemiluminescence.
FRAP
HeLa cells were washed twice with BMHH buffer and placed on the microscope stage at room temperature for imaging. FRAP of the Venus constructs was done using the 63 × 1.4 NA, Plan-Apochromat oil immersion objective lens of a Zeiss LSM710 confocal microscope with 514 nm excitation and 519–621 nm emission. Images were collected at 0.206 μm/pixel and 1-s frame rate for a total of 120 frames. After acquisition of five baseline images, a circular region of interest of 400 square pixels (17 μm2) was photobleached using 15 iterations of the 514 nm laser at 100% power. Dual color FRAP (Cerulean and Venus) was similarly collected using the 60 × 1.40 NA, PlanApo oil immersion lens of an Olympus FluoView 1000 microscope. For these experiments, the 405 nm laser was used for 45 ms at 100% to photobleach both Cerulean and Venus. The Cerulean and Venus images were collected sequentially to avoid spectral bleed through using 458 and 514 nm excitation with 464–511 and 531–631 nm emission wavelengths, respectively. FRAP image sequences were analyzed using the MacBiophotonics FRAP profiler of ImageJ (MacBiophotonics ImageJ version 1.42I+loci tool). The intensity versus time data collected from at least 10 cells were averaged, normalized, and fit to Phair's double normalization using OriginPro 8 SR0 software (OriginLab, Massachusetts).
The mobile fraction of a normalized curve is the plateau of the curve, and t½ is the time point at which the recovery is ½ the maximum. Mobile fraction and mobility are reported as the average ± S.E. of 3 or more experimental days with a minimum of 10 curves collected per day.
N&B Analysis
N&B analysis was done as described previously (20, 24). Briefly, N&B images were collected on an LSM710 confocal microscope (Carl Zeiss Microimaging) using a 63 × 1.4 NA Plan-Apochromat oil immersion objective lens. Cells were imaged at room temperature in BMHH imaging buffer within 30 min of being removed from the incubator to limit significant receptor redistribution (21). Fifty consecutive images were taken with a pixel dwell time of 12.61 μs and a frame time of 3.31 s. Each frame consisted of 512 × 512 pixels sized at 0.26 μm/pixel. Venus fluorescent protein-tagged proteins were imaged using 514 nm laser excitation with the internal spectral detector set as a 519-nm long-pass filter. Analysis was performed using custom plug-ins written for ImageJ (National Institutes of Health). To correct for photobleaching and cellular movement, each image series was processed with a recursive single-pole high-pass filter bidirectionally, as described previously (20). This filter preserves higher frequency fluctuations of intensity as well as the average intensity (supplemental Figs. S1 and S2). The apparent brightness (B/S) of each pixel was then calculated using the following (24).
 |
Here, 〈k〉 and σ2 are the mean and variance for each pixel over time. σo2, offset, and S are factors used to calibrate an analog detector for N&B analysis. The σo2 value is related to the dark current noise, and the offset is related to the digital level of the detector. The σo2 and offset values were obtained from the variance and peak, respectively, of the dark current histogram of images collected without laser excitation. A time series of images acquired at various laser powers was collected as described above except using an autofluorescent plastic slide (Chroma) to obtain S, the conversion factor between the number of photons to the digital levels of the detector. The variance of the images was plotted against the mean intensity, and the slope of the line was determined to be S.
The relative molecular brightness (ρ) was calculated from the following equation (25).
 |
Here, the subscripts indicate the apparent brightness of two separate samples (a and b). If one of the samples is known to diffuse as a monomer, the relative molecular brightness (ρ) value provides the absolute aggregation state (monomer, dimer, higher oligomer) (21, 25).
RESULTS
Fluorescent Protein Constructs
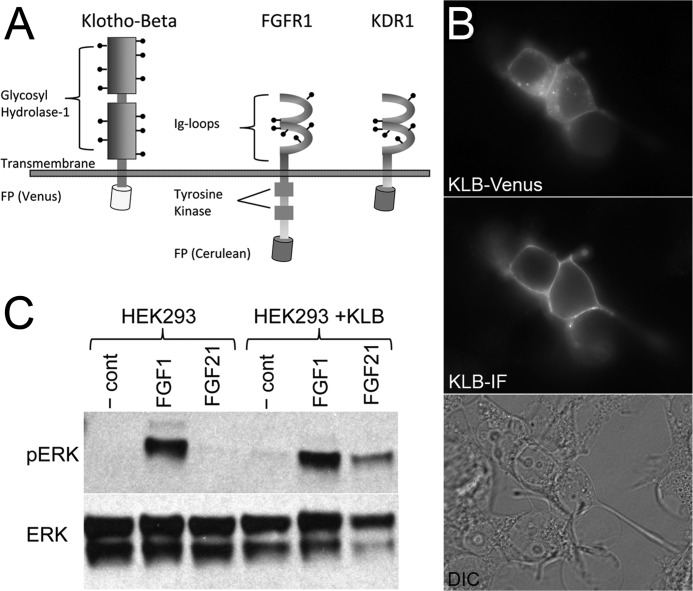
To measure KLB interaction with FGFR1 at the plasma membrane of living cells, we created fluorescent protein-tagged constructs of human KLB for comparison with previously characterized constructs of full-length and kinase-deficient FGFR1c with two IgG-like loops (Fig. 1) (22). KLB has a relatively large extracellular domain with 11 putative N-glycosylation sites, two inactive glycosyl hydrolase-1 domains, and a relatively short C-terminal tail (Fig. 1A). KLB-Venus expression was confirmed by detection of significant Venus fluorescence (Fig. 1B, top). Nonpermeabilized KLB-Venus cells also showed significant immunofluorescence using an antibody directed to the N terminus, indicating efficient translocation of the receptor to the plasma membrane (Fig. 1B, middle). To examine the activity of fluorescent protein-tagged KLB, we measured FGF21-stimulated ERK1/2 activation in HEK293T cells, which express multiple FGFRs but do not express KLB receptor (Fig. 1C). HEK293T cells were responsive to FGF1, a broadly active FGFR ligand, but were nonresponsive to FGF21 until transfected with the KLB-Venus construct. Overall, the addition of a fluorescent protein tag to KLB does not appear to alter its folding, translocation to the plasma membrane, or involvement in FGF21 signaling.
FIGURE 1.
Expression of fluorescent protein-tagged KLB and FGFR1 constructs. A, a schematic of fluorescent protein (FP)-tagged human KLB and FGFR1 fluorescent protein-tagged constructs. Human KLB (UniProt, Q86Z14) has a large extracellular domain (996 amino acids) with 11 putative N-glycosylation sites (indicated by stick and ball markings) and a short intracellular domain (27 amino acids). Human FGFR1c (UniProt, P11362-3) has a 265-amino acid extracellular domain with two IgG-like loops, six putative N-glycosylation sites, and a significantly longer intracellular domain (424 amino acids). The kinase-deficient receptor construct (KDR1) has a truncated intercellular domain with only 20 amino acids between the transmembrane domain and start of the fluorescent protein (depicted as a barrel). B, HeLa cells expressing KLB-Venus were fixed and immunofluorescently labeled for the extracellular domain of KLB. The top panel demonstrates Venus-associated fluorescence throughout the cell and at the plasma membrane. The middle panel demonstrates KLB-associated immunofluorescence in nonpermeabilized cells indicative of receptor detected at the plasma membrane. Cells in the entire field of view are shown in the differential interference contrast (DIC) image at the bottom. C, representative FGF1- and FGF21-induced phospho-ERK1/2 (pERK) activation detected by Western immunoblot. HEK293T cells endogenously express FGFR1 but do not express KLB. These cells respond to FGF1 (10 ng/ml) but are nonresponsive to FGF21 (100 ng/ml). In contrast, HEK293T overexpressing the KLB-Venus construct are responsive to both FGF1 (10 ng/ml) and FGF21 (100 ng/ml).
FGF21-stimulated ERK1/2 Activation and Galectin Lattice
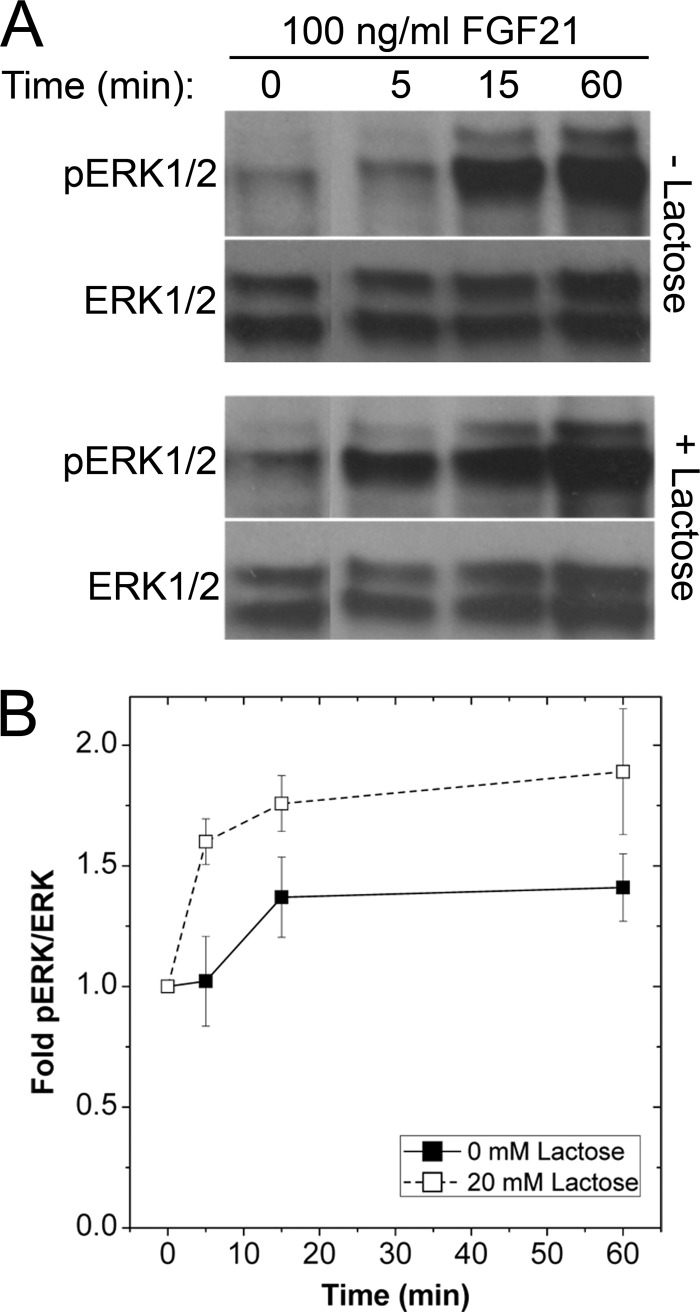
The galectin-glycoprotein lattice induces organized plasma membrane domains to regulate receptor signaling threshold and residency time (26). To determine whether KLB-FGFR1 signaling is affected by the galectin lattice, we examined temporal FGF21-induced phosphorylation of ERK1/2 in HeLa cells co-expressing KLB-Venus and R1-Cerulean (Fig. 2) (27, 28). We observed a more robust response to FGF21 in cells with a diminished galectin lattice by using lactose as a competitive inhibitor of glycoprotein binding to galectins (28) (Fig. 2, A and B). This modulated response to FGF21 suggests that FGFR1 and/or KLB bind to the galectin lattice to affect receptor signaling.
FIGURE 2.
Association with galectin lattice affects FGF21-stimulated phospho-ERK1/2 response. Prior to stimulation (100 ng/ml FGF21), HeLa cells co-transfected with KLB-Venus and R1-Cerulean were cultured in the presence or absence of lactose (20 mm; 48 h) and serum-starved (0.2% FBS) overnight. Cells were then stimulated with 100 ng/ml FGF21 (time points indicated) and harvested for Western immunoblot analysis. A and B, representative phospho-ERK1/2 (pERK1/2) and total ERK1/2 immunoblots (A) and the mean -fold phospho-ERK1/2 responses (B) revealed an earlier and more robust response to FGF21 after lactose treatment to dissolve the galectin lattice. Data are plotted as the mean -fold phospho-ERK1/2 response ± S.E. of five separate samples.
KLB and FGFR1c Plasma Membrane Macroscopic Diffusion
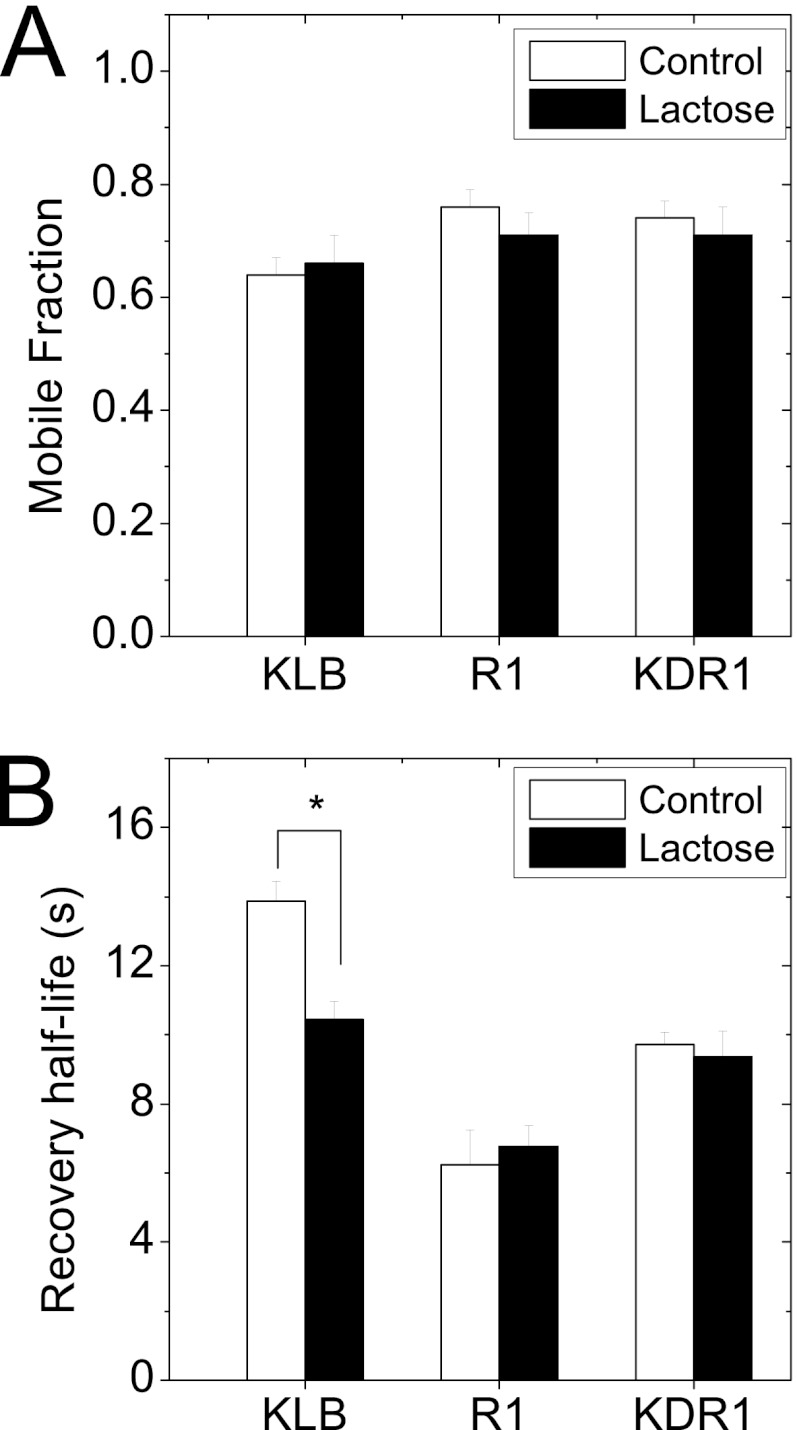
Receptors with a high degree of N-glycosylation have been shown to associate with the galectin-glycoprotein lattice through nonspecific galactoside binding (29). To determine whether KLB and FGFR1c with 11 and 6 N-glycosylations sites, respectively, associate with the galectin lattice, we measured the membrane diffusion of these constructs using FRAP (Fig. 3). The mobile fractions of KLB-Venus, R1-Venus, and KDR1-Venus were relatively similar and unchanged by treatment with lactose (Fig. 3A). In contrast, KLB-Venus had a significantly longer recovery half-life when compared with either R1-Venus or KDR1-Venus (Fig. 3B, open bars) and also showed a significant decrease in recovery half-life when treated with lactose (Fig. 3B). These data suggest KLB dynamically binds to the galectin lattice to affect the FGFR1-KLB-dependent response to FGF21.
FIGURE 3.
Lactose-dependent changes in KLB and FGFR1 diffusion at plasma membrane measured by FRAP. HeLa cells were transfected with KLB-Venus, R1-Venus, or KDR1-Venus 1 day prior to FRAP analysis. A and B, the mobile fraction (A) and recovery half-life (B) of each construct in the absence (white bars) and presence (black bars) of lactose (48 h) to remove the galectin lattice. Data shown are the mean ± S.E. for three or more sets of data, with each data set measured from 15 or more FRAP curves. * indicates p < 0.01 when compared with no lactose control using a Student's t test.
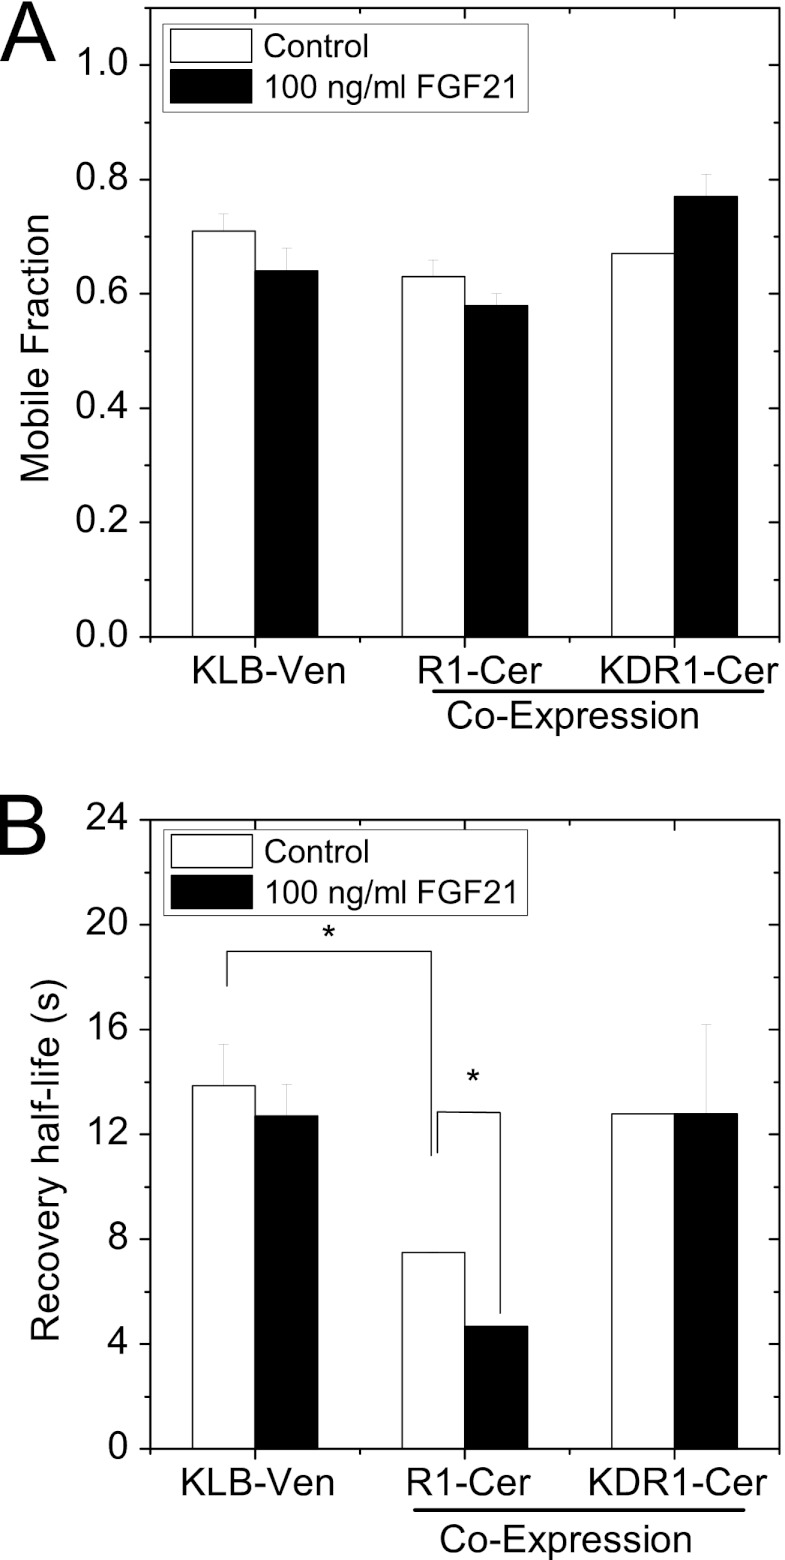
The significantly different recovery half-life of KLB when compared with FGFR1c suggested that interaction between the two receptors would affect the half-life of one or both receptors. To examine FGFR1c and KLB interaction in living cells, we measured the FRAP mobility of KLB-Venus in cells expressing KLB-Venus alone as well as in cells co-expressing KLB-Venus with R1-Cerulean or KDR1-Cerulean (Fig. 4). We observed no significant change in the mobile fraction of KLB-Venus when co-expressed with either R1-Cerulean or KDR1-Cerulean and subsequently treated with FGF21 (Fig. 4A). In contrast, we observed a significant decrease in the recovery half-life (faster diffusion) of KLB-Venus in the presence of R1-Cerulean, but not in the presence of KDR1-Cerulean (Fig. 4B, open bars). Subsequent addition of FGF21 caused a further significant decrease in recovery half-life (faster diffusion) of KLB-Venus in the presence of R1-Cerulean (Fig. 4B, open versus closed bars). We again observed no change in KLB-Venus dynamics in cells co-expressing KDR1-Cerulean, suggesting a role for the C terminus of FGFR1c in driving the interaction of the receptors. Finally, we observed no lactose-induced change in KLB-Venus mobility when co-expressed with R1-Cerulean (11.3 ± 3.7 s versus 11.5 ± 2.8 s). These data show that KLB forms faster diffusing and FGF21-responsive complexes with full-length FGFR1; nonetheless, the stoichiometry of their interaction is not well defined.
FIGURE 4.
FGFR1-dependent KLB receptor mobility measured by FRAP. HeLa cells were transfected with KLB-Venus alone or co-transfected with KLB-Venus (KLB-Ven) and either R1-Cerulean (R1-Cer) or KDR1-Cerulean (KDR1-Cer) 1 day prior to FRAP analysis. Another set of cells was treated with 100 ng/ml FGF21 immediately prior to imaging. A and B, the mobile fraction (A) and recovery half-life (B) of KLB-Venus are shown. The recovery half-life of KLB-Venus decreased in the presence of FGFR1 and FGFR1+FGF21 ligand, indicating increased diffusion rate. The data are plotted as the mean ± S.E. for three sets of data with each set of data from 15 or more FRAP curves. * indicates a p value of < 0.05 by Student's t test.
N&B Analysis
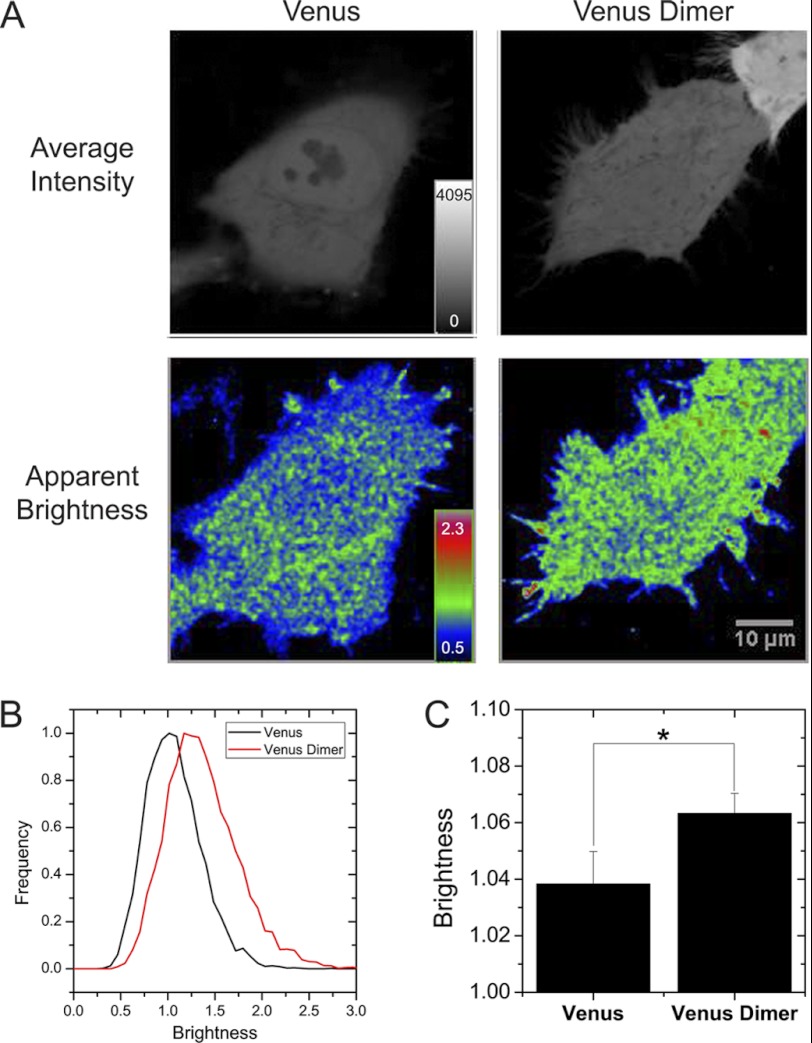
Our FRAP data suggested association of KLB and FGFR1c prior to the addition of FGF21 consistent with previous biochemical data (16, 30). To measure the stoichiometry of this interaction in living cells, we adopted N&B analysis (20). N&B analysis is a straightforward method to measure the molecular brightness of fluorophores to effectively quantify the protein aggregation state of fluorescent proteins in living cells. In contrast to macroscopic diffusion measured by FRAP, N&B analysis depends on microscopic diffusion in and out of each pixel volume to measure molecular distribution. To confirm this method in our own hands, we compared the apparent brightness of Venus fluorescent protein when expressed as a monomer and as a tandem dimer (Fig. 5). These two constructs were indistinguishable based on intensity with normal variability (Fig. 5A, Average Intensity panels). In contrast, the tandem dimer of Venus fluorescent protein showed a significantly greater apparent brightness than cells expressing Venus monomer (Fig. 5, A–C). Importantly, cells with very different intensity in the same image showed the same apparent brightness (Fig. 5A, Venus Dimer panels). The monomeric Venus and tandem Venus dimer data demonstrate that N&B analysis is a valuable tool to measure fluorescent protein aggregation state.
FIGURE 5.
Number and brightness analysis. HeLa cells were transfected with mVenus or tandem Venus dimer. A, representative images show the similarity of the average intensity between the Venus- and Venus dimer-expressing HeLa cells (top panels); however, the Venus Dimer panel shows a significantly higher apparent brightness than the Venus panel, suggesting a higher oligomerization state (bottom panels). The Venus dimer-expressing cell at the center of the image is significantly dimmer than the cell at the upper right edge of the same field of view, yet both have similar apparent brightness. B, representative histograms of the apparent brightness of individual pixels from single cells expressing monomeric Venus (black line) and a tandem dimmer of Venus (red line). C, the averaged apparent brightness of monomeric and dimeric Venus. The data are plotted as the mean ± S.E. for 29 or more cells. * indicates a p value of <0.05 by Student's t test.
N&B analysis can effectively measure absolute aggregation state of a receptor (monomer, dimer, or higher oligomer) by comparing relative molecular brightness (ρ) with a known monomeric isoform of the receptor (21). A receptor with a relative molecular brightness that is twice that of a monomer is effectively a dimer (25). In the absence of a known monomeric isoform of KLB and FGFR1c, we devised an alternative strategy to dilute the apparent brightness to monomeric values by using co-expression of identical dark receptors. Cerulean fluorescent protein is dark in our imaging setup due to selective excitation of the brighter and red-shifted Venus using the 514 nm laser line. By probabilistic formation of heteroaggregates, co-expression of identical receptors tagged with Cerulean and Venus was therefore expected to quantitatively lower the apparent brightness of the Venus-tagged receptors. The apparent brightness of KLB-Venus, R1-Venus, and KDR1-Venus when co-expressed with varying amounts of the identical Cerulean-tagged receptors is shown in Fig. 6A and supplemental Fig. S3. In the absence of Cerulean expression, R1-Venus and KDR1-Venus showed significantly higher apparent brightness than KLB-Venus. R1-Venus and KLB-Venus also showed a significant decrease in apparent brightness with Cerulean receptor co-expression. Assuming that the lower apparent brightness values correspond to monomers, R1-Venus and KDR1-Venus have a relative molecular brightness (ρ) approximately twice that of a monomer. In contrast, the apparent brightness of KLB-Venus was relatively unaffected by expression of Cerulean-tagged KLB, suggesting that KLB-Venus diffuses as a monomer.
FIGURE 6.
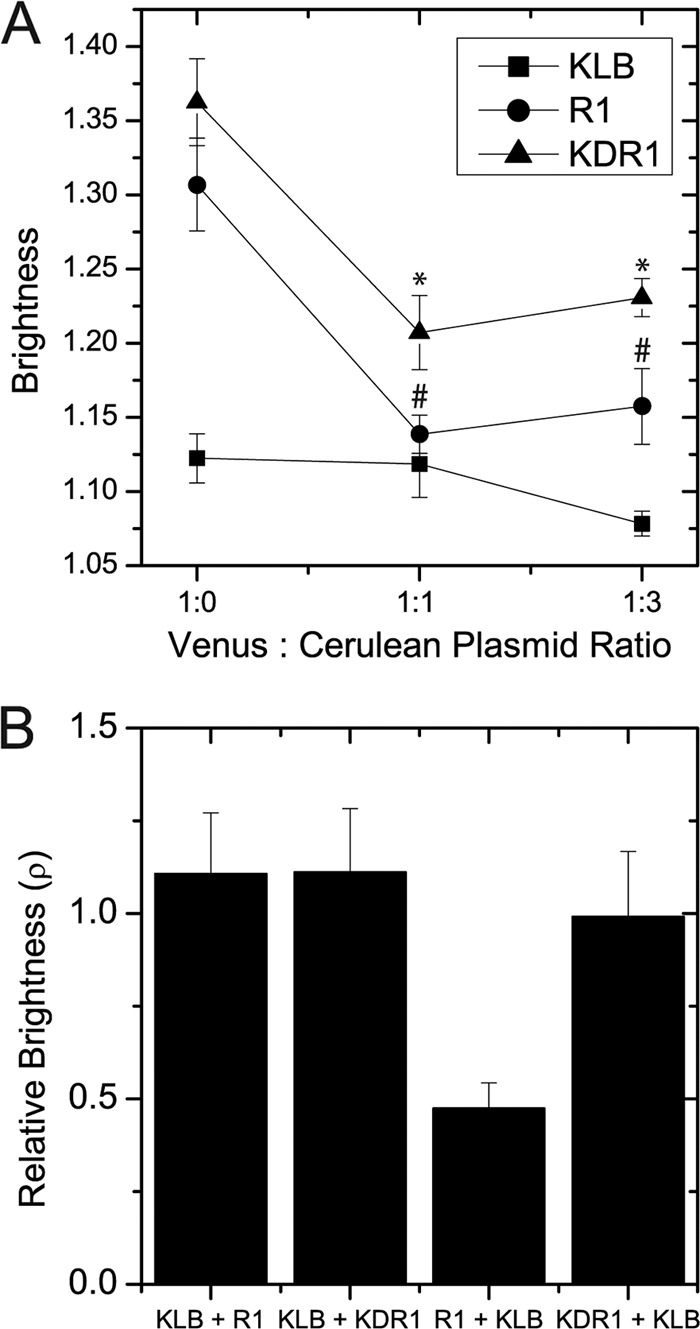
Aggregation state of R1-Venus, KDR1-Venus, and KLB-Venus in unstimulated cells. A, R1-Venus, KDR1-Venus, and KLB-Venus were co-expressed with their Cerulean counterparts at the plasmid mass ratio indicated. R1-Venus and KDR1-Venus showed a 2-fold decrease in relative brightness (ρ) after expressing their Cerulean counterparts. In contrast, KLB-Venus showed no difference after co-expression of KLB-Cerulean. The data are plotted as the mean ± S.E. for 12 or more cells. * and # indicate a p value of < 0.05 by Tukey's honestly significant difference test after one-way analysis of variance. B, the relative brightness (ρ) of KLB-Venus, R1-Venus, and KDR1-Venus after co-expression with the indicated receptor. After co-expression with KLB-Cerulean, the brightness of R1-Venus decreased almost 2-fold.
Effect of Co-receptor Expression on Receptor Distribution
To measure the effect of co-receptor expression on plasma membrane distribution, we compared the relative brightness of Venus-tagged receptors singly expressed and co-expressed with the appropriate Cerulean-tagged co-receptor (Fig. 6B). The relative molecular brightness (ρ) of KLB-Venus was unaffected by either R1-Cerulean or KDR1-Cerulean. In contrast, the brightness of R1-Venus decreased nearly 2-fold when co-expressed with KLB-Cerulean. This 2-fold decrease combined with the FGFR1c-induced decrease in KLB and FGFR1 half-life measured by FRAP indicates that KLB-Venus induces monomerization of R1-Venus by forming a 1:1 heterodimer. In contrast, the relative molecular brightness of KDR1-Venus was unaffected by KLB-Cerulean, suggesting that heterodimer formation requires interaction between the C termini of the receptors. Overall, the data demonstrate that only full-length FGFR1c was affected by KLB expression consistent with a 1:1 complex of KLB-FGFR1 prior to ligand addition.
Effect of FGF21 on Receptor Distribution
FGF21 signaling is presumed to occur through formation of a FGFR1c-KLB signaling complex. To examine receptor stoichiometry of this signaling complex in living cells, we compared the relative molecular brightness of the Venus-tagged KLB (Fig. 7A) and FGFR1 (R1 and KDR1) (Fig. 7B) in response to FGF21. KLB alone responded to FGF21 by increasing apparent brightness more than 2-fold, unless treated with lactose to dissolve the galectin lattice (Fig. 7A). KLB-Venus expressed with Cerulean-tagged full-length FGFR1 (KLB+R1) or kinase-deficient FGFR1 (KLB+KDR1) showed only a small increase in relative molecular brightness in accordance with the majority of KLB remaining monomeric upon ligand addition. In contrast to KLB, cells expressing FGFR1 or KDR1 alone showed no response to FGF21 (Fig. 7B). However, R1-Venus cells co-expressing KLB-Cerulean (R1 + KLB) showed a nearly 2-fold increase in molecular brightness in response to FGF21 consistent with ligand-induced dimerization of FGFR1. No significant response to FGF21 was observed in KDR1-Venus even when co-expressed with KLB-Cerulean (KDR1 + KLB), suggesting that KDR1 remains a dimer. These data demonstrate KLB receptor dimerization in the presence of the galectin lattice upon the addition of FGF21 and suggest that FGF21 binds to KLB in two separate locations to induce FGFR1-independent dimerization. KLB and FGFR1 therefore preform a 1:1 receptor complex that transitions to a 1:2 complex upon the addition of FGF21.
FIGURE 7.
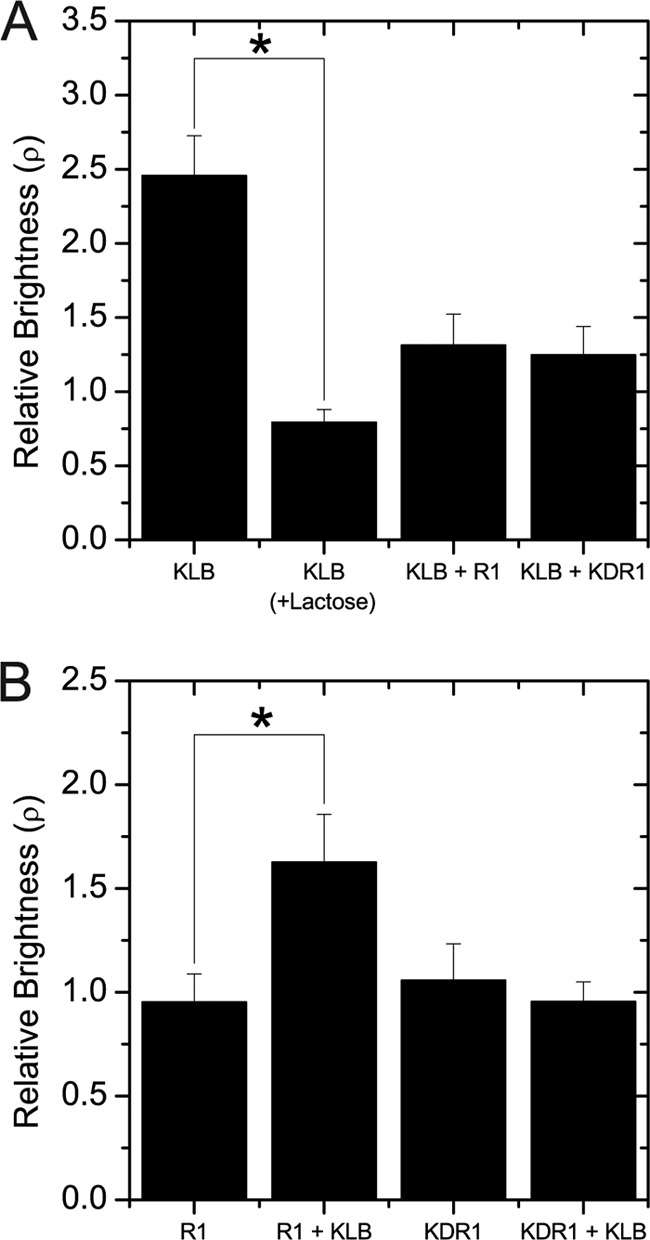
Stoichiometry of R1-Venus, KDR1-Venus, and KLB-Venus after FGF21 addition. A, KLB-Venus was expressed with either R1-Cerulean or KDR1-Cerulean for N&B analysis after FGF21 treatment. KLB-Venus showed a significant increase in aggregation state after the addition of FGF21 that was abolished by lactose treatment. KLB-Venus oligomerization did not significantly change after FGF21 addition when co-expressed with R1-Cerulean or KDR1-Cerulean. B, R1-Cerulean and KDR1-Cerulean were either singly expressed or co-expressed with KLB-Cerulean. R1-Venus showed a nearly 2-fold increase in oligomerization state after the addition of FGF21 when co-expressed with KLB-Cerulean. KDR1-Venus did not show the same effects after the addition of FGF21 when co-expressed with KLB-Cerulean, suggesting that dimerization of R1-Venus after the addition of FGF21 depends on the C terminus of the receptor. * indicates a p value of <0.05 by Student's t test.
KLB Association with Galectin Lattice in Endogenous Expression Model
Our data suggest that FGF21 activity is modulated by KLB receptor binding to the galectin lattice; however, these data were collected using an ectopic overexpression model. To confirm a similar effect in an endogenous expression model, we examined a mouse insulinoma β-cell line (βTC3) that expresses both KLB and FGFR1 (22) (Fig. 8).5 Consistent with our previous data, a more robust FGF21-induced phosphorylation of ERK1/2 was observed in cells treated with lactose (Fig. 8, A and B). Subsequently, we immunoprecipitated galectin-3 and immunoprobed the samples by Western blot analysis for KLB (Fig. 8C). A band corresponding to KLB with an approximate molecular mass of 130 kDa was observed in these immunoprecipitates. These data show that endogenous levels of KLB bind to the galectin lattice to modulate downstream signaling.
FIGURE 8.
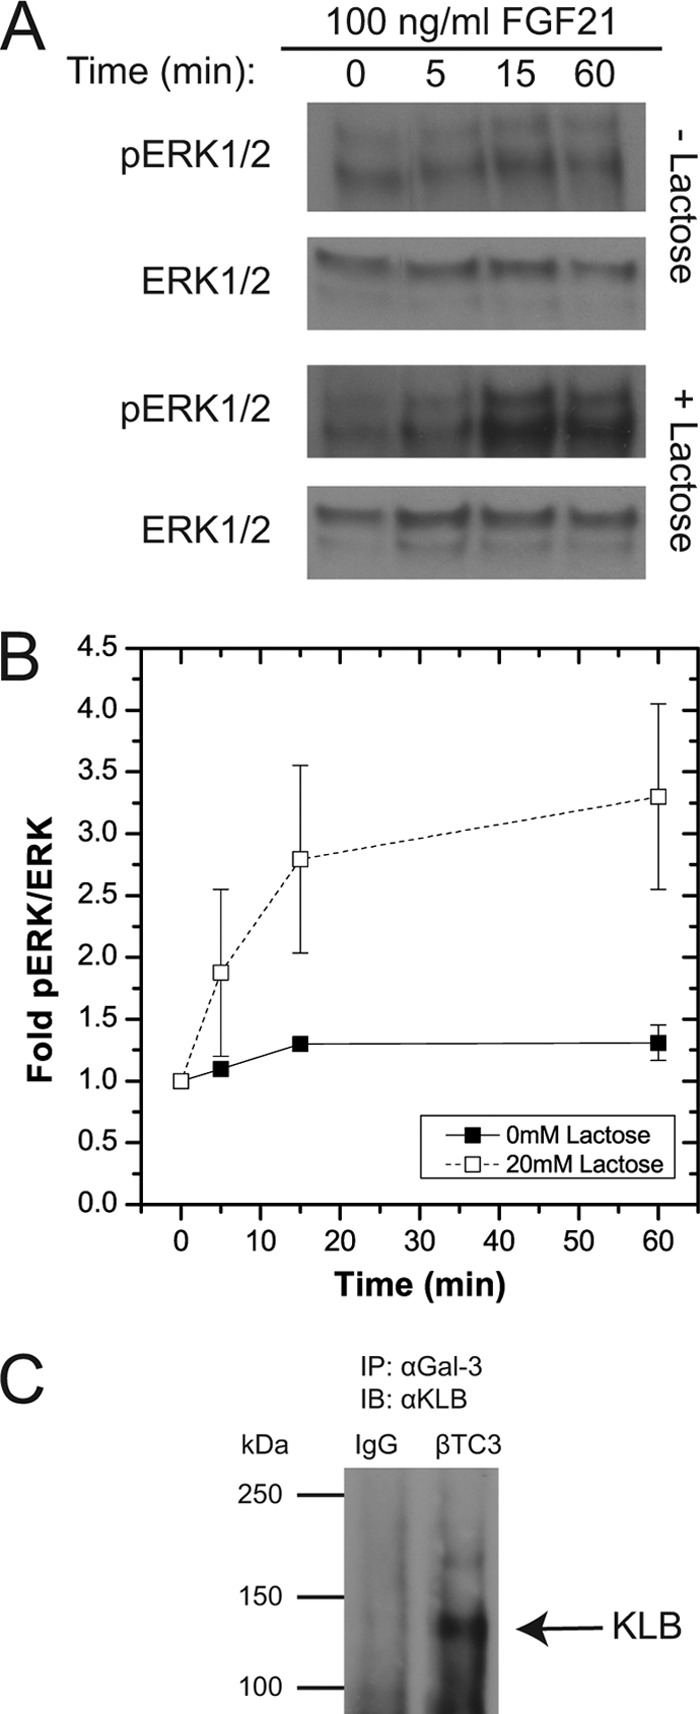
Association of endogenous KLB with galectin-3 in mouse insulinoma βTC3 cells affects FGF21-stimulated phospho-ERK1/2 response. FGF21-induced ERK1/2 activity and KLB receptor association with the galectin lattice were explored in mouse insulinoma βTC3 cells. A and B, to measure the effect of the galectin lattice on the FGF21-stimulated phospho-ERK1/2 (pERK1/2) response, βTC3 cells were cultured in the presence or absence of lactose (20 mm; 48 h). Cells were serum-starved (0.2% FBS) overnight prior to stimulation with FGF21 (100 ng/ml; time points indicated), and lysates were analyzed by Western immunoblot. A, a representative phospho-ERK1/2 blot was stripped and reprobed for total ERK1/2. B, the mean -fold phospho-ERK1/2 responses revealed a more robust response to FGF21 after lactose treatment. C, to measure KLB association with the galectin lattice, βTC3 cells were harvested for co-immunoprecipitation using anti-galectin-3 antibody followed by Western immunoblot (IB) using anti-KLB antibody. An ∼130-kDa band corresponding to KLB detected in anti-galectin-3 immunoprecipitates (IP) was absent in control immunoprecipitates (mouse IgG control). Data are plotted as the mean -fold phospho-ERK1/2 response ± S.E. of three separate samples.
DISCUSSION
These studies explored FGF21-induced signaling through KLB and FGFR1c in living cells using complementary biophysical techniques. Consistent with regulation of signaling at the plasma membrane, dissolving the galectin lattice with lactose increased the FGF21-stimulated ERK1/2 response. To examine receptor interaction at the plasma membrane, FRAP was used to determine the macroscopic diffusion of the fluorescent protein-tagged receptors. In particular, we measured receptor binding to the galectin lattice as well as co-receptor interactions. N&B analysis was used to determine the aggregation state of the receptors and to specifically measure changes in receptor distribution with co-receptor expression and the addition of ligand. Our results are consistent with FGF21 signaling being regulated by the galectin lattice and with KLB competitively released from the lattice by FGFR1c. Consistently, we observed KLB association with galectin-3 by co-immunoprecipitation. Likewise, FGFR1c behaves as a dimer when expressed alone, but forms a 1:1 heterocomplex when co-expressed with KLB. Subsequent addition of FGF21 induced dimerization of FGFR1c, presumably forming a 1:2 KLB-FGFR1c complex.
Galectins are a family of lectins that have one or more carbohydrate recognition domains to bind β-galactosides such as lactose (26, 32). Galectins form an extracellular lattice through binding β-galactosides on plasma membrane glycoproteins. The affinity and avidity of a receptor glycoprotein to bind the galectin lattice is determined by the amount and composition of glycosylation (29). KLB and FGFR1c have 11 and 6 putative N-glycosylation sites, respectively, suggesting that KLB is more likely than FGFR1c to associate with the lattice. We used exogenous lactose to competitively dissolve the lattice and found that KLB showed evidence of association, whereas FGFR1c did not (28). We further confirmed association of KLB with the galectin lattice by co-immunoprecipitation with galectin-3. These studies are not the first to link a klotho family member and galectins; Klothoα has been shown to increase the binding affinity of TrpV5 channel to the galectin lattice by enzymatic cleavage of sialic acids (33). However, these studies are the first, to our knowledge, to show a direct interaction between a klotho receptor (KLB) and the galectin lattice. In contrast to our data, previous modeling of the ERK1/2 responses of various receptor tyrosine kinases suggested that FGFR1 binds to the lattice (29). We postulate that this contradiction may be due to our use of the two-IgG-like loop version of FGFR1, rather than the more heavily glycosylated three-IgG-like loop receptor with eight putative N-glycosylation sites (29).
The galectin lattice organizes membrane domains that regulate the signaling threshold and residency time of membrane receptors (26, 32). Through mechanisms that are not clearly understood, receptor signaling has been shown to be either positively or negatively regulated by galectins. Our data show a delayed and reduced ERK1/2 response that correlated with KLB binding to the galectin lattice, suggesting a role in diminishing FGF21 signaling. Future studies will need to determine the effect of receptor expression on retention at the plasma membrane and whether all levels of receptor expression show decreased downstream signaling due to galectin binding. As a potential therapeutic target, our data suggest that manipulation of KLB-binding to the galectin lattice is a viable strategy to control FGF21-stimulated responses.
KLB diffusion rate increased with co-expression of full-length FGFR1c and subsequent addition of FGF21. The similar diffusion rates of KLB and FGFR1c after co-expression suggest that KLB-Venus is competitively released from the galectin lattice by interaction with R1-Cerulean. Furthermore, these data also suggest that KLB-Venus and R1-Cerulean form a heterocomplex with higher mobility than KLB-Venus alone. The same effect was not observed with co-expression of KDR1-Cerulean, suggesting that formation of the KLB-FGFR1c heterocomplex requires interaction between the C terminus of the receptors. In agreement with our findings, KLB and FGFR1c have previously been shown to co-immunoprecipitate prior to ligand addition (16). Our study uniquely demonstrates this effect in the plasma membrane of living cells and reveals a role for C-terminal interaction. Overall, our FRAP data are consistent with the mobility of KLB receptor distribution and dynamics being affected by the galectin lattice, FGFR1c co-expression, and subsequent addition of FGF21.
We applied N&B to measure the molecular distribution of KLB and FGFR1c in the presence of co-receptor and FGF21 ligand. This method uses a series of images to measure variance of the intensity in each pixel (20, 21, 24). An increase in variance indicates greater apparent brightness (the brightness of each independent diffusing unit) due to aggregation state of the fluorescent protein-tagged receptors. To determine the absolute aggregation state of our Venus-tagged receptors, we devised a strategy using co-expression of identical Cerulean-tagged receptors. In essence, this strategy allowed us to calculate the absolute aggregation state of the Venus-tagged receptors using the relative brightness (ρ). Using this strategy, full-length (R1-Venus) and kinase-deficient (KDR1-Venus) FGFR1c were both shown to express as homodimers. These data are consistent with previous biochemical studies suggesting that FGFR1 forms homodimers (34). This finding is somewhat controversial and suggests that subsequent paracrine FGF signaling is induced by allosteric modification of the kinase domains rather than simply by receptor dimerization. It should also be realized that these measurements are being made in the presence of the extracellular matrix including endogenous HSPGs, which may facilitate FGFR1c dimer formation. This finding may also reflect our choice of the two-IgG-like loop isoform of FGFR1c rather than the three-IgG-like loop version, which contains an autoregulatory loop that may block the formation of dimers (35). Our data and previous studies showed no evidence for ligand-independent activation by R1-Venus, which suggests that the preformed dimers are not active and that this result is not due to an artifact of overexpression (22). However, future studies will need to determine whether FGFR1c is also dimeric at endogenous receptor levels.
In contrast to R1- and KDR1-Venus, KLB-Venus expressed alone as a monomer. Subsequent addition of FGF21 induced dimers of KLB, suggesting that monomeric FGF21 binds KLB in two unique positions or that dimeric FGF21 binds in a single position. Consistent with a two-site binding model, FGF ligands are generally appreciated to be monomeric until bound to heparin sulfate (36). FGF21 did not induce KLB-Venus aggregation after lactose treatment, consistent with one or both of the binding sites on KLB being supported by interaction with the galectin lattice. FGF21 also caused no change in KLB mobility, suggesting that this aggregation occurred with KLB still bound to the galectin lattice. The binding and aggregation of KLB by FGF21 are therefore conceptually very similar to the binding of classical FGFs (FGF1, -2, etc.) to HSPGs. KLB essentially acts as a co-receptor for FGFR1 and as a reservoir for FGF21 binding to the extracellular matrix.
Co-expression of KLB and FGFR1c did not change the aggregation state of KLB, but induced monomers of FGFR1c. These data combined with our FRAP data suggested a direct 1:1 interaction between KLB and FGFR1c. Subsequent addition of FGF21 caused no change in KLB aggregation state, but induced dimers of FGFR1, suggesting formation of a 1:2 signaling complex. However, it should also be noted that application of N&B as used here does not directly measure interaction of the heteroreceptors. The stoichiometry of paracrine FGF signaling complex through FGFR1 is widely debated (36–39) with two prevailing models: a symmetric binding model (2:2 ratio of HSPG-FGFR1) (36, 37) and a nonsymmetric binding model (1:2 ratio of HSPG-FGFR1) (38, 39). It should also be considered that FGFR1 signaling may progress through either a 2:2 or 1:2 complex based on context. For instance, it has been postulated that formation of the 2:2 complex through closer FGFR1-FGFR1 interaction results in a robust and long-term mitogenic signal. In contrast, the 1:2 complex has limited FGFR1-FGFR1 interaction and may result in a less robust response to elicit different outcomes. If one considers that KLB replaces HSPGs in the role as the FGFR1c co-receptor, then our data are consistent with an asymmetric model (38, 39). It is therefore interesting to postulate that FGF21 regulation of cellular fatty acid metabolism is due to formation of a less potent 1:2 complex of KLB-FGFR1c (31). Future studies will also need to determine the aggregation state of HSPGs to determine their role in the FGF21 signaling complex (31).
Acknowledgment
The microscope used in these studies was purchased through a Canadian Foundation for Innovation Leaders Opportunity Fund (18301) to J. V. Rocheleau.
This work was supported by grants from the Canadian Institutes for Health Research (NMD106997) (to J. V. R. and D. M. K.) and the Heart and Stroke Foundation of Ontario (NA6591) (to J. V. R.).

This article contains supplemental Figs. S1–S3.
M. S. Sun, E. Yoo, B. J. Green, S. M. Altamentova, D. M. Kilkenny, and J. V. Rocheleau, manuscript in preparation.
- FGFR
- fibroblast growth factor receptor
- KLB
- Klothoβ
- FRAP
- fluorescence recovery after photobleaching
- N&B
- number and brightness
- HSPG
- heparin sulfate proteoglycan.
REFERENCES
- 1. Itoh N., Ornitz D. M. (2004) Evolution of the Fgf and Fgfr gene families. Trends Genet. 20, 563–569 [DOI] [PubMed] [Google Scholar]
- 2. Ornitz D. M., Itoh N. (2001) Fibroblast growth factors. Genome Biol. 2, REVIEWS3005 [DOI] [PMC free article] [PubMed] [Google Scholar]
- 3. Johnson D. E., Williams L. T. (1993) Structural and functional diversity in the FGF receptor multigene family. Adv. Cancer Res. 60, 1–41 [DOI] [PubMed] [Google Scholar]
- 4. Kharitonenkov A. (2009) FGFs and metabolism. Curr. Opin. Pharmacol. 9, 805–810 [DOI] [PubMed] [Google Scholar]
- 5. Badman M. K., Pissios P., Kennedy A. R., Koukos G., Flier J. S., Maratos-Flier E. (2007) Hepatic fibroblast growth factor 21 is regulated by PPARα and is a key mediator of hepatic lipid metabolism in ketotic states. Cell Metab. 5, 426–437 [DOI] [PubMed] [Google Scholar]
- 6. Inagaki T., Dutchak P., Zhao G., Ding X., Gautron L., Parameswara V., Li Y., Goetz R., Mohammadi M., Esser V., Elmquist J. K., Gerard R. D., Burgess S. C., Hammer R. E., Mangelsdorf D. J., Kliewer S. A. (2007) Endocrine regulation of the fasting response by PPARα-mediated induction of fibroblast growth factor 21. Cell Metab. 5, 415–425 [DOI] [PubMed] [Google Scholar]
- 7. Kharitonenkov A., Shiyanova T. L., Koester A., Ford A. M., Micanovic R., Galbreath E. J., Sandusky G. E., Hammond L. J., Moyers J. S., Owens R. A., Gromada J., Brozinick J. T., Hawkins E. D., Wroblewski V. J., Li D. S., Mehrbod F., Jaskunas S. R., Shanafelt A. B. (2005) FGF-21 as a novel metabolic regulator. J. Clin. Invest. 115, 1627–1635 [DOI] [PMC free article] [PubMed] [Google Scholar]
- 8. Kharitonenkov A., Shanafelt A. B. (2008) Fibroblast growth factor-21 as a therapeutic agent for metabolic diseases. BioDrugs 22, 37–44 [DOI] [PubMed] [Google Scholar]
- 9. Goetz R., Beenken A., Ibrahimi O. A., Kalinina J., Olsen S. K., Eliseenkova A. V., Xu C., Neubert T. A., Zhang F., Linhardt R. J., Yu X., White K. E., Inagaki T., Kliewer S. A., Yamamoto M., Kurosu H., Ogawa Y., Kuro-o M., Lanske B., Razzaque M. S., Mohammadi M. (2007) Molecular insights into the klotho-dependent, endocrine mode of action of fibroblast growth factor 19 subfamily members. Mol. Cell. Biol. 27, 3417–3428 [DOI] [PMC free article] [PubMed] [Google Scholar]
- 10. Harmer N. J., Pellegrini L., Chirgadze D., Fernandez-Recio J., Blundell T. L. (2004) The crystal structure of fibroblast growth factor (FGF) 19 reveals novel features of the FGF family and offers a structural basis for its unusual receptor affinity. Biochemistry 43, 629–640 [DOI] [PubMed] [Google Scholar]
- 11. Mohammadi M., Olsen S. K., Ibrahimi O. A. (2005) Structural basis for fibroblast growth factor receptor activation. Cytokine Growth Factor Rev. 16, 107–137 [DOI] [PubMed] [Google Scholar]
- 12. Ogawa Y., Kurosu H., Yamamoto M., Nandi A., Rosenblatt K. P., Goetz R., Eliseenkova A. V., Mohammadi M., Kuro-o M. (2007) βKlotho is required for metabolic activity of fibroblast growth factor 21. Proc. Natl. Acad. Sci. U.S.A. 104, 7432–7437 [DOI] [PMC free article] [PubMed] [Google Scholar]
- 13. Suzuki M., Uehara Y., Motomura-Matsuzaka K., Oki J., Koyama Y., Kimura M., Asada M., Komi-Kuramochi A., Oka S., Imamura T. (2008) βKlotho is required for fibroblast growth factor (FGF) 21 signaling through FGF receptor (FGFR) 1c and FGFR3c. Mol. Endocrinol. 22, 1006–1014 [DOI] [PMC free article] [PubMed] [Google Scholar]
- 14. Kurosu H., Choi M., Ogawa Y., Dickson A. S., Goetz R., Eliseenkova A. V., Mohammadi M., Rosenblatt K. P., Kliewer S. A., Kuro-o M. (2007) Tissue-specific expression of βKlotho and fibroblast growth factor (FGF) receptor isoforms determines metabolic activity of FGF19 and FGF21. J. Biol. Chem. 282, 26687–26695 [DOI] [PMC free article] [PubMed] [Google Scholar]
- 15. Ito S., Kinoshita S., Shiraishi N., Nakagawa S., Sekine S., Fujimori T., Nabeshima Y. I. (2000) Molecular cloning and expression analyses of mouse βklotho, which encodes a novel Klotho family protein. Mech Dev. 98, 115–119 [DOI] [PubMed] [Google Scholar]
- 16. Kharitonenkov A., Dunbar J. D., Bina H. A., Bright S., Moyers J. S., Zhang C., Ding L., Micanovic R., Mehrbod S. F., Knierman M. D., Hale J. E., Coskun T., Shanafelt A. B. (2008) FGF-21/FGF-21 receptor interaction and activation is determined by βKlotho. J. Cell Physiol. 215, 1–7 [DOI] [PubMed] [Google Scholar]
- 17. Kharitonenkov A., Shanafelt A. B. (2009) FGF21: a novel prospect for the treatment of metabolic diseases. Curr. Opin. Investig. Drugs 10, 359–364 [PubMed] [Google Scholar]
- 18. Yie J., Hecht R., Patel J., Stevens J., Wang W., Hawkins N., Steavenson S., Smith S., Winters D., Fisher S., Cai L., Belouski E., Chen C., Michaels M. L., Li Y. S., Lindberg R., Wang M., Véniant M., Xu J. (2009) FGF21 N and C termini play different roles in receptor interaction and activation. FEBS Lett. 583, 19–24 [DOI] [PubMed] [Google Scholar]
- 19. Reits E. A., Neefjes J. J. (2001) From fixed to FRAP: measuring protein mobility and activity in living cells. Nat. Cell Biol. 3, E145–147 [DOI] [PubMed] [Google Scholar]
- 20. Digman M. A., Dalal R., Horwitz A. F., Gratton E. (2008) Mapping the number of molecules and brightness in the laser scanning microscope. Biophys. J. 94, 2320–2332 [DOI] [PMC free article] [PubMed] [Google Scholar]
- 21. Nagy P., Claus J., Jovin T. M., Arndt-Jovin D. J. (2010) Distribution of resting and ligand-bound ErbB1 and ErbB2 receptor tyrosine kinases in living cells using number and brightness analysis. Proc. Natl. Acad. Sci. U.S.A. 107, 16524–16529 [DOI] [PMC free article] [PubMed] [Google Scholar]
- 22. Kilkenny D. M., Rocheleau J. V. (2008) Fibroblast growth factor receptor-1 signaling in pancreatic islet β-cells is modulated by the extracellular matrix. Mol. Endocrinol. 22, 196–205 [DOI] [PMC free article] [PubMed] [Google Scholar]
- 23. Kircheis R., Kichler A., Wallner G., Kursa M., Ogris M., Felzmann T., Buchberger M., Wagner E. (1997) Coupling of cell-binding ligands to polyethylenimine for targeted gene delivery. Gene Ther. 4, 409–418 [DOI] [PubMed] [Google Scholar]
- 24. Dalal R. B., Digman M. A., Horwitz A. F., Vetri V., Gratton E. (2008) Determination of particle number and brightness using a laser scanning confocal microscope operating in the analog mode. Microsc. Res. Tech. 71, 69–81 [DOI] [PubMed] [Google Scholar]
- 25. Ossato G., Digman M. A., Aiken C., Lukacsovich T., Marsh J. L., Gratton E. (2010) A two-step path to inclusion formation of huntingtin peptides revealed by number and brightness analysis. Biophys. J. 98, 3078–3085 [DOI] [PMC free article] [PubMed] [Google Scholar]
- 26. Brewer C. F., Miceli M. C., Baum L. G. (2002) Clusters, bundles, arrays, and lattices: novel mechanisms for lectin-saccharide-mediated cellular interactions. Curr. Opin. Struct. Biol. 12, 616–623 [DOI] [PubMed] [Google Scholar]
- 27. Lajoie P., Partridge E. A., Guay G., Goetz J. G., Pawling J., Lagana A., Joshi B., Dennis J. W., Nabi I. R. (2007) Plasma membrane domain organization regulates EGFR signaling in tumor cells. J. Cell Biol. 179, 341–356 [DOI] [PMC free article] [PubMed] [Google Scholar]
- 28. Partridge E. A., Le Roy C., Di Guglielmo G. M., Pawling J., Cheung P., Granovsky M., Nabi I. R., Wrana J. L., Dennis J. W. (2004) Regulation of cytokine receptors by Golgi N-glycan processing and endocytosis. Science 306, 120–124 [DOI] [PubMed] [Google Scholar]
- 29. Lau K. S., Partridge E. A., Grigorian A., Silvescu C. I., Reinhold V. N., Demetriou M., Dennis J. W. (2007) Complex N-glycan number and degree of branching cooperate to regulate cell proliferation and differentiation. Cell 129, 123–134 [DOI] [PubMed] [Google Scholar]
- 30. Kurosu H., Ogawa Y., Miyoshi M., Yamamoto M., Nandi A., Rosenblatt K. P., Baum M. G., Schiavi S., Hu M. C., Moe O. W., Kuro-o M. (2006) Regulation of fibroblast growth factor-23 signaling by klotho. J. Biol. Chem. 281, 6120–6123 [DOI] [PMC free article] [PubMed] [Google Scholar]
- 31. Nakamura M., Uehara Y., Asada M., Honda E., Nagai N., Kimata K., Suzuki M., Imamura T. (2011) Sulfated glycosaminoglycans are required for specific and sensitive fibroblast growth factor (FGF) 19 signaling via FGF receptor 4 and βKlotho. J. Biol. Chem. 286, 26418–26423 [DOI] [PMC free article] [PubMed] [Google Scholar]
- 32. Garner O. B., Baum L. G. (2008) Galectin-glycan lattices regulate cell surface glycoprotein organization and signaling. Biochem. Soc Trans 36, 1472–1477 [DOI] [PMC free article] [PubMed] [Google Scholar]
- 33. Chang Q., Hoefs S., van der Kemp A. W., Topala C. N., Bindels R. J., Hoenderop J. G. (2005) The β-glucuronidase klotho hydrolyzes and activates the TRPV5 channel. Science 310, 490–493 [DOI] [PubMed] [Google Scholar]
- 34. Wang F., Kan M., McKeehan K., Jang J. H., Feng S., McKeehan W. L. (1997) A homeo-interaction sequence in the ectodomain of the fibroblast growth factor receptor. J. Biol. Chem. 272, 23887–23895 [DOI] [PubMed] [Google Scholar]
- 35. Lemmon M. A., Schlessinger J. (2010) Cell signaling by receptor tyrosine kinases. Cell 141, 1117–1134 [DOI] [PMC free article] [PubMed] [Google Scholar]
- 36. Beenken A., Mohammadi M. (2009) The FGF family: biology, pathophysiology, and therapy. Nat. Rev. Drug Discov. 8, 235–253 [DOI] [PMC free article] [PubMed] [Google Scholar]
- 37. Schlessinger J., Plotnikov A. N., Ibrahimi O. A., Eliseenkova A. V., Yeh B. K., Yayon A., Linhardt R. J., Mohammadi M. (2000) Crystal structure of a ternary FGF-FGFR-heparin complex reveals a dual role for heparin in FGFR binding and dimerization. Mol. Cell 6, 743–750 [DOI] [PubMed] [Google Scholar]
- 38. Goodger S. J., Robinson C. J., Murphy K. J., Gasiunas N., Harmer N. J., Blundell T. L., Pye D. A., Gallagher J. T. (2008) Evidence that heparin saccharides promote FGF2 mitogenesis through two distinct mechanisms. J. Biol. Chem. 283, 13001–13008 [DOI] [PubMed] [Google Scholar]
- 39. Pellegrini L., Burke D. F., von Delft F., Mulloy B., Blundell T. L. (2000) Crystal structure of fibroblast growth factor receptor ectodomain bound to ligand and heparin. Nature 407, 1029–1034 [DOI] [PubMed] [Google Scholar]


