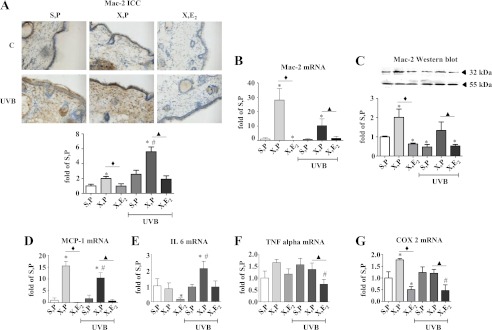
FIGURE 9.
Inflammatory responses to E2 and UVB in vivo. The inflammatory response was analyzed in the dermis of skin biopsies derived from 18-week-old hairless skh-1 mice treated as described in the legend of Fig. 1. A, immunostaining of Mac-2 as marker of inflammatory macrophages; B, MAC-2 mRNA expression; C, Mac-2 immunoblotting and quantification related to tubulin as loading control (55 kDa); D, MCP-1 mRNA expression; E, IL6 mRNA expression; F, TNFα mRNA expression; G, COX2 mRNA expression as an inducible gene associated with inflammation and release of inflammatory chemokines and cytokines. ×100x magnification; n = 3–12, mean ± S.E.; *, p < 0.05 versus S,P; #, p < 0.05 versus S,P UVB; ♦, p < 0.05 versus X,P; ▴, p < 0.05 versus X,P UVB.

