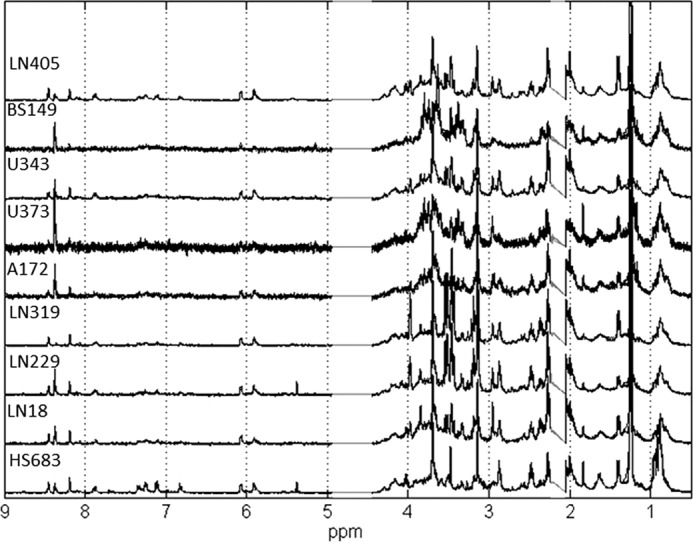
FIGURE 1.

NMR spectra of five biological replicates for nine glioblastoma cell lines studied in this work. The good consistency among replicates is apparent from spectral traces. Only the spectral region between 0.5 and 9 ppm is shown. Spectral points in the region between 2.1 and 2.2 ppm contain residual hydrogen-containing solvent and are therefore removed, as well as the region of 4.5–5 ppm, which is affected by water suppression.
