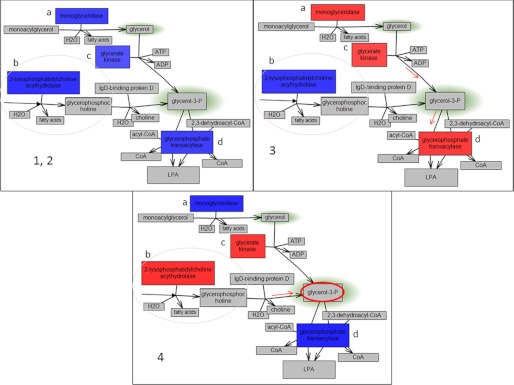
FIGURE 10.
Partial representation of triacylglycerol and glycerophospholipid metabolism related to synthesis and digestion of glycerol 3-phosphate. Glycerol 3-phosphate is overconcentrated in group 4 (highlighted in red). The gene colors represent relative expression levels in: panel 1, 2, group 1 relative to groups 2, 3, and 4 and group 2 relative to groups 1, 3, and 4 (same relative expression); panel 3, group 3 relative to groups 1, 2, and 4; and panel 4, group 4 relative to groups 1, 2, and 3, where red shows overexpression and blue shows underexpression. The branch of the triacylglycerol pathway is circled. The presented genes are: a, monoglyceridase; b, 2-lysophosphatidylcholine acylhydrolase; c, glycerate kinase; d, glycerophosphate transacylase. Glycerol 3-phosphate is overconcentrated in group 4 cells, and this can be related to up-regulation of 2-lysophosphatidylcholine acylhydrolase and glycerate kinase, both involved in glycerol 3-phosphate synthesis, and down-regulation of glycerophosphate transacylase, which is involved in its digestion. LPA, lysophosphatidic acid.

