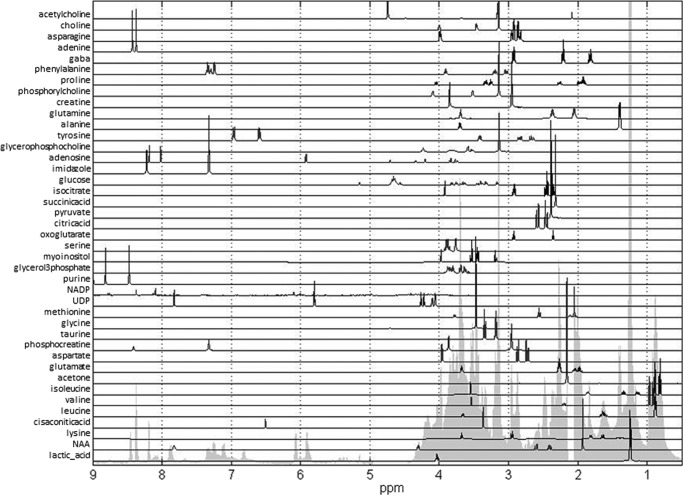
FIGURE 2.
Spectra of metabolites used for multivariate linear regression analysis of glioblastoma spectra. Forty-one metabolites used in the analysis included all metabolites previously determined in NMR measurements of hydrophilic glioblastoma samples as well as samples of other cell lines. One-dimensional spectra of all 41 metabolites are shown in this figure along with the outline of the average spectrum for glioblastoma cell lines. Complete spectra of all metabolites were used in multivariate linear regression analysis.

