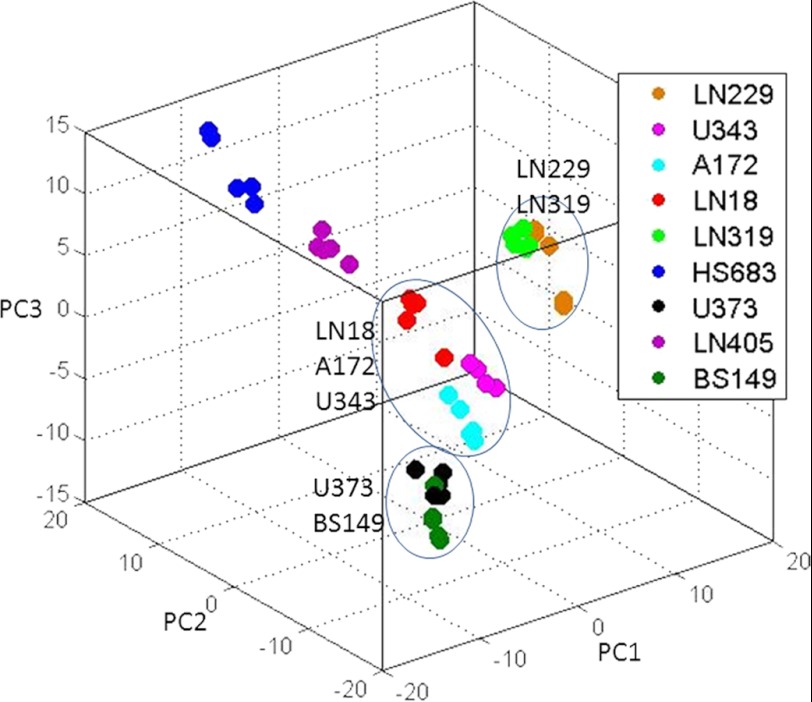
FIGURE 3.
Principal components analysis of spectral data for nine GBM cell lines. Metabolites were independently extracted and measured for five biological replicates corresponding to nine cell line types. The grouping of several cell types is apparent. Comparison between PCA results of spectral and quantified metabolic data is shown in supplemental Figs. 1 and 2.

