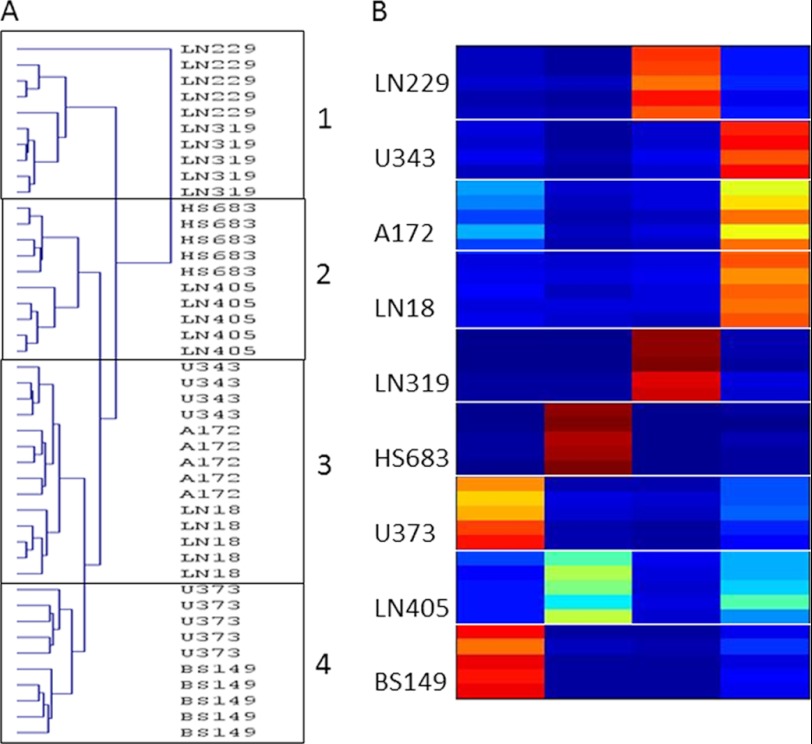
FIGURE 4.
FKM and HCL clustering of spectral data. A, HCL result for cell samples. B, FKM determined membership values for each measurement, where red represents the membership value of 1, and dark blue corresponds to membership of 0. Higher membership value indicates stronger belonging to a cluster. FKM was calculated with m = 1.8. Comparison between FKM clustering of spectral and quantified metabolic data is shown in supplemental Fig. 3.

