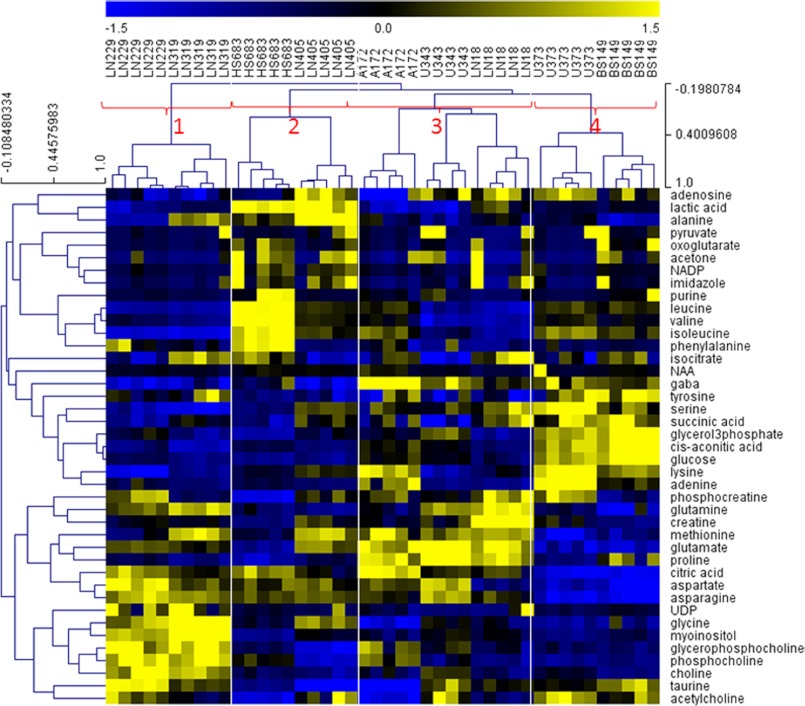
FIGURE 5.
HCL clustering of quantitative metabolite data obtained using Levenberg-Marquardt multivariate linear regression method with spectral measurements for 41 metabolites from metabolomics databases with metabolite values normalized (divided by standard deviation and mean-centered). Sample types are grouped similarly, based on these quantitative metabolic data, as they were with spectral data in Figs. 3 and 4.

