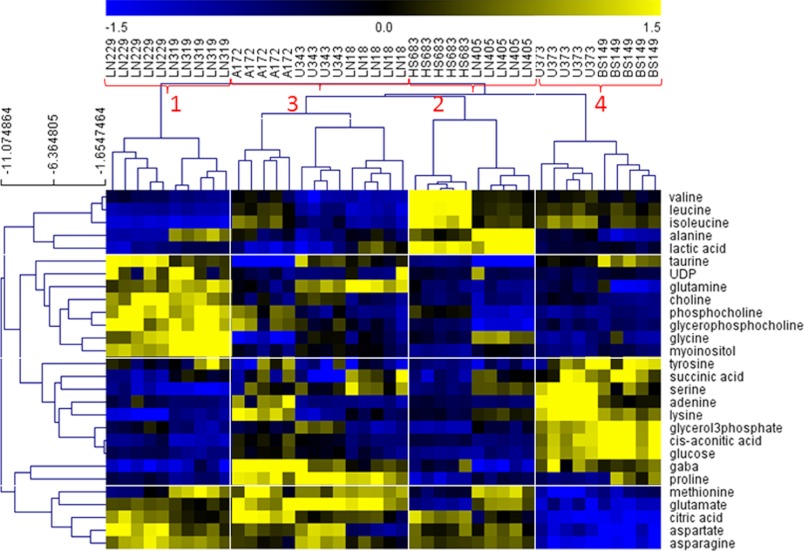
FIGURE 6.
HCL clustering of metabolites selected as most differentially concentrated between the four groups. The feature selection was performed from quantitative metabolite data using SAM analysis. Prior to SAM analysis, metabolite values were normalized (divided by standard deviation and mean-centered). SAM Δ value was 0.2 with zero median number of false significant metabolites. Outlined are sample and metabolite groups, which show the metabolites that are most significant for separation of samples for each group from all the other groups.

