FIGURE 7.

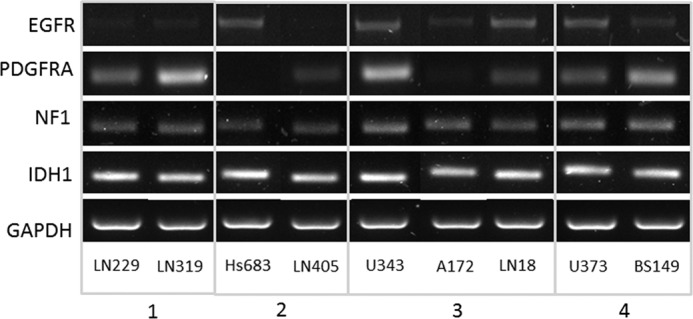
Molecular footprints of the nine GBM cell lines assessed in the current study. Selected transcripts of interest, EGFR, PDGFRA, NF1, and IDH1, were amplified in the GBM cell models by RT-PCR.

Molecular footprints of the nine GBM cell lines assessed in the current study. Selected transcripts of interest, EGFR, PDGFRA, NF1, and IDH1, were amplified in the GBM cell models by RT-PCR.