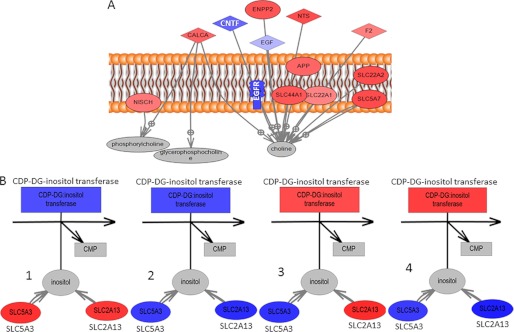
FIGURE 8.
Direct connection network between gene expression and metabolites that are overconcentrated in group 1. A, genes directly involved in the transport of choline (particularly SCL44A1) are overexpressed in group 1 cells. In the figure, genes that are overexpressed in Group 1 relative to the other groups are shown in red, and the ones that are underexpressed in group 1 are shown in blue. B, relation between inositol and its transporter genes (SLC5A3 and SLC2A13) as well as enzyme involved in its digestion (inositol transferase). In subplots B1–B4, coloring is used to describe gene expression difference across four cell line types. Subplot B1 shows expression of genes in group 1 relative to groups 2, 3 and 4; subplot B2 shows expression of genes in group 2 relative to groups 1, 3, and 4; subplot B3 shows expression of genes in group 3 relative to groups 1, 2, and 4; and subplot B4 shows expression of genes in group 4 relative to groups 1, 2, and 3. Inositol is overconcentrated in group 1, and this can be related to the overexpression of its transporters as well as underexpression of the digestion enzyme. CALCA, calcitonin-related polypeptide alpha; CNTF, ciliary neurotrophic factor; NISCH, nischarin; NTS, neurotensin; APP, amyloid beta (A4) precursor protein; CDP-DG, cytidine diphosphate-diacylglycerol.

