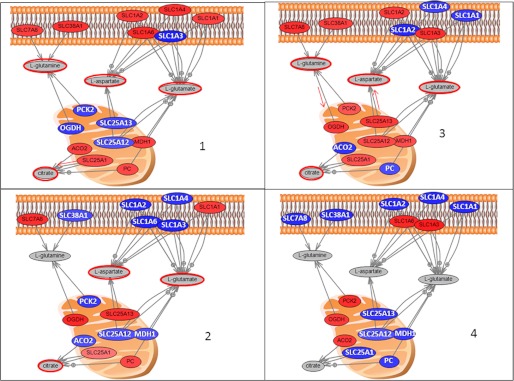
FIGURE 9.
Direct connection network between gene expression and metabolites that are overconcentrated in some of the groups. Included are l-glutamine (overconcentrated in groups 1 and 3), l-glutamate (overconcentrated in groups 1, 2, and 3), l-aspartate (overconcentrated in groups 1, 2, and 3), and citrate (overconcentrated in groups 1, 2, and 3) with metabolite overconcentration highlighted in red. Genes are colored based on their expression in one group relative to all the others, i.e. panel 1 is expression in 1 relative to 2, 3, and 4; panel 2 is expression in 2 relative to 1, 3, and 4; panel 3 is expression in 3 relative to 1, 2, and 4, and panel 4 is expression in 4 relative to 1, 2, and 3. According to the changes in metabolite concentration and gene expression, we are hypothesizing major transporters for each metabolite listed, and this is outlined with red arrows on the graph. PC, phosphorylcholine.

